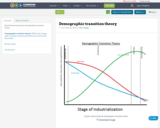
Graph demonstrating the demographic transition theory
- Subject:
- Life Science
- Social Science
- Material Type:
- Diagram/Illustration
- Date Added:
- 02/23/2017

Graph demonstrating the demographic transition theory

Introduction to Sociology 2e adheres to the scope and sequence of a typical, one-semester introductory sociology course. It offers comprehensive coverage of core concepts, foundational scholars, and emerging theories, which are supported by a wealth of engaging learning materials. The textbook presents detailed section reviews with rich questions, discussions that help students apply their knowledge, and features that draw learners into the discipline in meaningful ways. The second edition retains the book’s conceptual organization, aligning to most courses, and has been significantly updated to reflect the latest research and provide examples most relevant to today’s students. In order to help instructors transition to the revised version, the 2e changes are described within the preface.


Understand demographic measurements like fertility and mortality ratesDescribe a variety of demographic theories, such as Malthusian, cornucopian, zero population growth, and demographic transition theoriesBe familiar with current population trends and patternsUnderstand the difference between an internally displaced person, an asylum-seeker, and a refugee