Unrestricted Use
CC BY
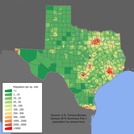
Texas’ Demographic
- Subject:
- Political Science
- Material Type:
- Homework/Assignment
- Reading
- Author:
- Annette Howard
- Date Added:
- 12/06/2019
Texas’ Demographic
Texas’ Demographic
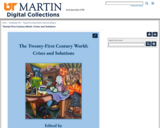
How do you teach world current events? From history textbooks? From the internet? From watching the news? The 21st Century World: Crises and Solutions, aims to remedy a scarcity of comprehensive analysis of world events. It recollects the recent past, analyzes the factors that destabilize and threaten human life, and examines sustainable and fair solutions. The chapters are organized in four parts: sustainability, demographics, literacy, and freedoms. Coverage includes the sustainability of land and water use, poverty-induced issues such as health, hunger, and homelessness, the global economy, population distribution and location, migrations and refugees, education and information and issues of violence that find outlets in oppression, protests, war, and terrorism.
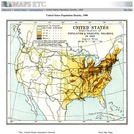
A map from 1912 of the United States, subtitled "Distribution of Population and Railways in 1900" showing the increase in population and expansion of the railroad network since 1850. The map is color–coded to show population densities ranging from areas with fewer than 2 inhabitants per square mile to areas of 90 or more inhabitants per square mile. Cities with populations over 8,000 are shown with circles proportionate to their populations at the time. The map shows the westward progression of the mean centers of population from 1790 to 1900.
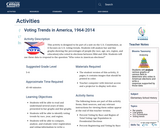
This activity is designed to be part of a unit on the U.S. Constitution, as it focuses on U.S. voting trends. Students will analyze bar and line graphs showing the percentages of people (by race, age, sex, region, and education) who voted in elections between 1964 and 2014. Students will use these data to respond to the question “Who votes in American elections?”