Working as if they are engineers aiming to analyze and then improve …
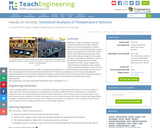
Working as if they are engineers aiming to analyze and then improve data collection devices for precision agriculture, students determine how accurate temperature sensors are by comparing them to each other. Teams record soil temperature data during a class period while making changes to the samples to mimic real-world crop conditions—such as the addition of water and heat and the removal of the heat. Groups analyze their collected data by finding the mean, median, mode, and standard deviation. Then, the class combines all the team data points in order to compare data collected from numerous devices and analyze the accuracy of their recording devices by finding the standard deviation of temperature readings at each minute. By averaging the standard deviations of each minute’s temperature reading, students determine the accuracy of their temperature sensors. Students present their findings and conclusions, including making recommendations for temperature sensor improvements.
This resource is a Google Sheet Template that aids students and teachers …
This resource is a Google Sheet Template that aids students and teachers in tracking individual student grades based on the number of points they've earned in the course compared to the total number of points available.
This Google Sheet was created to support a Time Management module in …
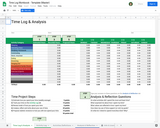
This Google Sheet was created to support a Time Management module in a Strategies for College Success course. The plan is for the instructor to share one copy of the Sheet with each student for an assignment lasting 2 or 3 weeks. Students estimate the time they spend each week on common daily tasks, such as sleeping, working, or attending class. Space is provided for students to enter up to three custom tasks. After estimating how they spend time, students track their time spent for a full week. Through the magic of spreadsheet formulas, time spent per task is color-coded to help visualize large and small blocks of time. Time for the week is tallied on the summary tab, where a warning message appears if less than 24 hours are logged for any given day. After comparing their estimated hours to their actual recorded hours, students propose changes they can make in how they spend their time to increase their scholastic success. A tab with five questions is included for student reflection. Instructions for how to use the Sheet are provided for faculty on the Info & LIcense tab. Cell formulas are editable only by the document owner; students cannot accidentally overwrite. Colors are selected from a palette known to be perceivable by people with most forms of colorblindness. Author contact information is available on the Info and License tab.
No restrictions on your remixing, redistributing, or making derivative works. Give credit to the author, as required.
Your remixing, redistributing, or making derivatives works comes with some restrictions, including how it is shared.
Your redistributing comes with some restrictions. Do not remix or make derivative works.
Most restrictive license type. Prohibits most uses, sharing, and any changes.
Copyrighted materials, available under Fair Use and the TEACH Act for US-based educators, or other custom arrangements. Go to the resource provider to see their individual restrictions.