This course is designed mainly for political science graduate students conducting or …
This course is designed mainly for political science graduate students conducting or considering conducting research on identity politics. While 17.504 Ethnic Politics I is designed as a primarily theoretical course, Ethnic Politics II switches the focus to methods. It aims to familiarize the student with the current conventional approaches as well as major challenges to them. The course discusses definition and measurement issues as well as briefly addressing survey techniques and modeling.
The Experimental Project Lab in the Department of Aeronautics and Astronautics is …
The Experimental Project Lab in the Department of Aeronautics and Astronautics is a two-semester course sequence: 16.621 Experimental Projects I (this course) and 16.622 Experimental Projects II. This site offers material on 16.621. In the course, two-person teams initiate a project of their own conception and design in 16.621 and then complete it in 16.622. For many students, this is a first encounter with research standards and techniques. It is a complicated course that requires a lot of interaction and support and also access to facilities and materials, but it is rewarding for students to explore an hypothesis under the guidance of a faculty advisor. This OCW site presents the building block materials of the course, which can provide only a profile of the course because the most important learning elements are the interactions between student team, faculty, project advisor, and shop staff and also between student team members. However, this site offers some of the preparation and guidance materials for students embarking on an experimental project. To emphasize the focus on communication skills, a set of study materials and examples of student work are provided.
The Experimental Project Lab in the Department of Aeronautics and Astronautics is …
The Experimental Project Lab in the Department of Aeronautics and Astronautics is a two-semester course sequence: 16.621 Experimental Projects I and 16.622 Experimental Projects II (this course). Students in 16.622 gain practical insight and improved understanding of engineering experimentation through design and execution of “project” experiments. Building upon work in course 16.621, students construct and test equipment, make systematic experimental measurements of phenomena, analyze data, and compare theoretical predictions with results. Deliverables comprise a written final project report and formal oral presentations. Instructions on oral presentations and multi-section reporting are given. Experimental Projects I and II provide a valuable link between theory (16.621) and practice (16.622).
This course provides a foundation to the design of the environment from …
This course provides a foundation to the design of the environment from the scale of the object, to the building to the larger territory. The design disciplines of architecture as well as urbanism and landscape are examined in context of the larger influence of the arts and sciences. Students are expected to develop skills in thinking and analysis, spatial representation, and design methodologies. Through lectures and design exercises, students are provided an opportunity to establish a reference for understanding the discipline of architecture and environmental design, and are given an introduction to design fundamentals and the design process.
This course introduces machining operations as they relate to the metalworking industry. …
This course introduces machining operations as they relate to the metalworking industry. Topics include machine shop safety, measuring tools, lathes, drilling machines, saws, milling machines, bench grinders, and layout instruments. Upon completion, students should be able to safely perform the basic operations of measuring, layout, drilling, sawing, turning, and milling.
Distributions and Variability Type of Unit: Project Prior Knowledge Students should be …
Distributions and Variability
Type of Unit: Project
Prior Knowledge
Students should be able to:
Represent and interpret data using a line plot. Understand other visual representations of data.
Lesson Flow
Students begin the unit by discussing what constitutes a statistical question. In order to answer statistical questions, data must be gathered in a consistent and accurate manner and then analyzed using appropriate tools.
Students learn different tools for analyzing data, including:
Measures of center: mean (average), median, mode Measures of spread: mean absolute deviation, lower and upper extremes, lower and upper quartile, interquartile range Visual representations: line plot, box plot, histogram
These tools are compared and contrasted to better understand the benefits and limitations of each. Analyzing different data sets using these tools will develop an understanding for which ones are the most appropriate to interpret the given data.
To demonstrate their understanding of the concepts, students will work on a project for the duration of the unit. The project will involve identifying an appropriate statistical question, collecting data, analyzing data, and presenting the results. It will serve as the final assessment.
Surface Area and Volume Type of Unit: Conceptual Prior Knowledge Students should …
Surface Area and Volume
Type of Unit: Conceptual
Prior Knowledge
Students should be able to:
Identify rectangles, parallelograms, trapezoids, and triangles and their bases and heights. Identify cubes, rectangular prisms, and pyramids and their faces, edges, and vertices. Understand that area of a 2-D figure is a measure of the figure's surface and that it is measured in square units. Understand volume of a 3-D figure is a measure of the space the figure occupies and is measured in cubic units.
Lesson Flow
The unit begins with an exploratory lesson about the volumes of containers. Then in Lessons 2–5, students investigate areas of 2-D figures. To find the area of a parallelogram, students consider how it can be rearranged to form a rectangle. To find the area of a trapezoid, students think about how two copies of the trapezoid can be put together to form a parallelogram. To find the area of a triangle, students consider how two copies of the triangle can be put together to form a parallelogram. By sketching and analyzing several parallelograms, trapezoids, and triangles, students develop area formulas for these figures. Students then find areas of composite figures by decomposing them into familiar figures. In the last lesson on area, students estimate the area of an irregular figure by overlaying it with a grid. In Lesson 6, the focus shifts to 3-D figures. Students build rectangular prisms from unit cubes and develop a formula for finding the volume of any rectangular prism. In Lesson 7, students analyze and create nets for prisms. In Lesson 8, students compare a cube to a square pyramid with the same base and height as the cube. They consider the number of faces, edges, and vertices, as well as the surface area and volume. In Lesson 9, students use their knowledge of volume, area, and linear measurements to solve a packing problem.
This course is an introduction to designing mechatronic systems, which require integration …
This course is an introduction to designing mechatronic systems, which require integration of the mechanical and electrical engineering disciplines within a unified framework. There are significant laboratory-based design experiences. Topics covered in the course include: Low-level interfacing of software with hardware; use of high-level graphical programming tools to implement real-time computation tasks; digital logic; analog interfacing and power amplifiers; measurement and sensing; electromagnetic and optical transducers; control of mechatronic systems.
This course develops logical, empirically based arguments using statistical techniques and analytic …
This course develops logical, empirically based arguments using statistical techniques and analytic methods. Elementary statistics, probability, and other types of quantitative reasoning useful for description, estimation, comparison, and explanation are covered. Emphasis is on the use and limitations of analytical techniques in planning practice.
This is a laboratory experience course with a focus on photography, electronic …
This is a laboratory experience course with a focus on photography, electronic imaging, and light measurement, much of it at short duration. In addition to teaching these techniques, the course provides students with experience working in a laboratory and teaches good work habits and techniques for approaching laboratory work. A major purpose of 6.163 is to provide students with many opportunities to sharpen their communication skills: oral, written, and visual.
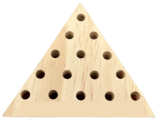
This unit will introduce students to measurement and using a drill press, …
This unit will introduce students to measurement and using a drill press, bandsaw and scroll saw. Students will be designing and creating a triangle golf tee game as an intro to tool usage.
No restrictions on your remixing, redistributing, or making derivative works. Give credit to the author, as required.
Your remixing, redistributing, or making derivatives works comes with some restrictions, including how it is shared.
Your redistributing comes with some restrictions. Do not remix or make derivative works.
Most restrictive license type. Prohibits most uses, sharing, and any changes.
Copyrighted materials, available under Fair Use and the TEACH Act for US-based educators, or other custom arrangements. Go to the resource provider to see their individual restrictions.