Proportional Relationships Type of Unit: Concept Prior Knowledge Students should be able …
Proportional Relationships
Type of Unit: Concept
Prior Knowledge
Students should be able to:
Understand what a rate and ratio are. Make a ratio table. Make a graph using values from a ratio table.
Lesson Flow
Students start the unit by predicting what will happen in certain situations. They intuitively discover they can predict the situations that are proportional and might have a hard time predicting the ones that are not. In Lessons 2–4, students use the same three situations to explore proportional relationships. Two of the relationships are proportional and one is not. They look at these situations in tables, equations, and graphs. After Lesson 4, students realize a proportional relationship is represented on a graph as a straight line that passes through the origin. In Lesson 5, they look at straight lines that do not represent a proportional relationship. Lesson 6 focuses on the idea of how a proportion that they solved in sixth grade relates to a proportional relationship. They follow that by looking at rates expressed as fractions, finding the unit rate (the constant of proportionality), and then using the constant of proportionality to solve a problem. In Lesson 8, students fine-tune their definition of proportional relationship by looking at situations and determining if they represent proportional relationships and justifying their reasoning. They then apply what they have learned to a situation about flags and stars and extend that thinking to comparing two prices—examining the equations and the graphs. The Putting It Together lesson has them solve two problems and then critique other student work.
Gallery 1 provides students with additional proportional relationship problems.
The second part of the unit works with percents. First, percents are tied to proportional relationships, and then students examine percent situations as formulas, graphs, and tables. They then move to a new context—salary increase—and see the similarities with sales taxes. Next, students explore percent decrease, and then they analyze inaccurate statements involving percents, explaining why the statements are incorrect. Students end this sequence of lessons with a formative assessment that focuses on percent increase and percent decrease and ties it to decimals.
Students have ample opportunities to check, deepen, and apply their understanding of proportional relationships, including percents, with the selection of problems in Gallery 2.
Samples and ProbabilityType of Unit: ConceptualPrior KnowledgeStudents should be able to:Understand the …
Samples and ProbabilityType of Unit: ConceptualPrior KnowledgeStudents should be able to:Understand the concept of a ratio.Write ratios as percents.Describe data using measures of center.Display and interpret data in dot plots, histograms, and box plots.Lesson FlowStudents begin to think about probability by considering the relative likelihood of familiar events on the continuum between impossible and certain. Students begin to formalize this understanding of probability. They are introduced to the concept of probability as a measure of likelihood, and how to calculate probability of equally likely events using a ratio. The terms (impossible, certain, etc.) are given numerical values. Next, students compare expected results to actual results by calculating the probability of an event and conducting an experiment. Students explore the probability of outcomes that are not equally likely. They collect data to estimate the experimental probabilities. They use ratio and proportion to predict results for a large number of trials. Students learn about compound events. They use tree diagrams, tables, and systematic lists as tools to find the sample space. They determine the theoretical probability of first independent, and then dependent events. In Lesson 10 students identify a question to investigate for a unit project and submit a proposal. They then complete a Self Check. In Lesson 11, students review the results of the Self Check, solve a related problem, and take a Quiz.Students are introduced to the concept of sampling as a method of determining characteristics of a population. They consider how a sample can be random or biased, and think about methods for randomly sampling a population to ensure that it is representative. In Lesson 13, students collect and analyze data for their unit project. Students begin to apply their knowledge of statistics learned in sixth grade. They determine the typical class score from a sample of the population, and reason about the representativeness of the sample. Then, students begin to develop intuition about appropriate sample size by conducting an experiment. They compare different sample sizes, and decide whether increasing the sample size improves the results. In Lesson 16 and Lesson 17, students compare two data sets using any tools they wish. Students will be reminded of Mean Average Deviation (MAD), which will be a useful tool in this situation. Students complete another Self Check, review the results of their Self Check, and solve additional problems. The unit ends with three days for students to work on Gallery problems, possibly using one of the days to complete their project or get help on their project if needed, two days for students to present their unit projects to the class, and one day for the End of Unit Assessment.
Students begin to formalize their understanding of probability. They are introduced to …
Students begin to formalize their understanding of probability. They are introduced to the concept of probability as a measure of likelihood and how to calculate probability as a ratio. The terms discussed (impossible, certain, etc.) in Lesson 1 are given numerical values.Key ConceptsStudents will think of probability as a ratio; it can be written as a fraction, decimal, or a percent ranging from 0 to 1.Students will think about ratio and proportion to predict results.Goals and Learning ObjectivesDefine probability as a measure of likelihood and the ratio of favorable outcomes to the total number of outcomes for an event.Predict results based on theoretical probability using ratio and proportion.
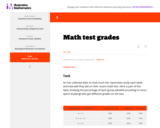
The goal of this task is twofold. For part (a) since we …
The goal of this task is twofold. For part (a) since we are not given how large each of the groups in the table are, the best we can do is to apply reasoning about ratios (in the form of percents) to give a range of possible answers. For part (b), the goal is to recognize a misuse of statistical reasoning.
Two besotted rulers must embrace proportional units in order to unite their …
Two besotted rulers must embrace proportional units in order to unite their lands. It takes mathematical reasoning to identify the problem, and solution, when engineers from Queentopia and Kingopolis build a bridge to meet in the middle of the river.
In this activity, students will explore the use of a hemocytometer for …
In this activity, students will explore the use of a hemocytometer for counting cells, demonstrate the relationship between the grid seen in the microscope with volume of liquid in suspension and count cells to determine concentration.
Andrea Kowalchik has her students move around the room in pairs while …
Andrea Kowalchik has her students move around the room in pairs while solving proportion problems that are tacked to the walls. This lesson is easy to prepare, fun for students, and gets them working quickly while being active all at the same time.
The battle is on in this game where you build your own …
The battle is on in this game where you build your own potions! Check your ratios to win this mixture mix-off. Ratio Rumble guides students in: identifying ratios when used in a variety of contextual situations; providing visual representations of ratios; solving common problems or communicating by using rate, particularly unit rates; and explaining why ratios and rates naturally relate to fractions and decimals.
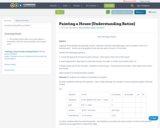
Students often think additively rather than multiplicatively. For example, if you present …
Students often think additively rather than multiplicatively. For example, if you present the scenario, "One puppy grew from 5 pounds to 10 pound. Another puppy grew from 100 pounds to 108 pounds." and ask, "Which puppy grew more?" someone who is thinking additively will say that the one who now weighs 108 grew more because he gained 8 pounds while the other gained 5 pounds. Someone who is thinking multiplicatively will say that the one that now weighs 10 pounds grew more because he doubled his weight while the other only added a few pounds. While both are correct answers, multiplicative thinking is needed for proportional reasoning. If your students are thinking additively, you can nudge them toward multiplicative thinking with this activity.
Play with the left and right hands in different ways, and explore …
Play with the left and right hands in different ways, and explore ratio and proportion. Start on the Discover screen to find each challenge ratio by moving the hands. Then, on the Create screen, set your own challenge ratios. Once you've found a challenge ratio, try to move both hands while maintaining the challenge ratio through proportional reasoning.
Proportional relationships are everywhere. They are used to compare professional athletes and …
Proportional relationships are everywhere. They are used to compare professional athletes and to help shoppers get the “best bang for their buck” at the grocery store. They help us build models and designs and are used in many business applications. This lesson plan introduces proportional relationships, ratios and unit rates at the grade 6/7 (C) level and requires adult learners to identify and compare ratios using the Padlet application.
Proportional relationships are everywhere. They are used to compare professional athletes and …
Proportional relationships are everywhere. They are used to compare professional athletes and to help shoppers get the “best bang for their buck” at the grocery store. They help us build models and designs and are used in many business applications. This lesson plan introduces proportional relationships, ratios and unit rates at the grade 6/7 (C) level and requires adult learners to apply ratios in the context of cooking. The bonus challenge: the learner completes Worksheet 2 and modifies a larger quantity ofthe ingredients.
Proportional relationships are everywhere. They are used to compare professional athletes and …
Proportional relationships are everywhere. They are used to compare professional athletes and to help shoppers get the “best bang for their buck” at the grocery store. They help us build models and designs and are used in many business applications. This lesson plan introduces proportional relationships, ratios and unit rates at the grade 6/7 (C) level and requires adult learners to apply ratios in the context of cooking. Learners will need learn to research basic information and be challenged to present their “final recipe” creatively.
Size, Scales, and Specialization was developed as part of an effort by …
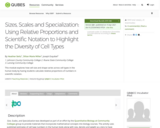
Size, Scales, and Specialization was developed as part of an effort by the Quantitative Biology at Community Colleges group to provide materials that incorporate mathematical concepts into biology courses. The activity uses published estimates of cell type numbers in the human body along with size, density and weight as a lens to have students calculate ratios, explore exponents, and better understand how the various cell types contribute to an average human's total weight and size. The activity is applicable for majors and non-majors biology courses, and maps to Chapter 4 of the OpenStax Biology 2e textbook. This activity could also be used in a mathematics course as a biologically relevant example.
The activity contains a pre-assessment to gauge student understanding of the material and provides an opportunity for students to predict the number of various cell types, as well as the mass of various cell types, in the human body. This prediction activity is followed with a guided approach to calculating these values. After guiding the students in this activity, students will then have a chance to practice the activity on a new set of cell data provided.
After completing this module students should be able to:
- Compare and contrast the structure and function of different cell types. -- List the largest and the smallest cells in the body based on number. -- List the largest and the smallest cells in the body based on mass. - Describe the advantages of specialization in eukaryotic cells. -- Give examples of how specialization in cell types affects cell size (volume) and shape. - Perform measurements and conversions using the metric system. -- Measure the scale of cell size variation in the human body -- Calculate the relative proportions of cell types in the human body by mass and frequency
Why are Cells Small? was developed as part of an effort by …
Why are Cells Small? was developed as part of an effort by the Quantitative Biology at Community Colleges group to provide materials that incorporate mathematical concepts into biology courses. The activity was designed for a non-majors biology course, and maps to Chapter 4 of the OpenStax Biology 2e textbook. This activity could also be used in a mathematics course as a biologically relevant example.
After completing this module students should be able to:
- Explain the relationship of surface area to volume - Describe the importance of a large surface area to volume ratio in the context of a living cell - Calculate surface area of cubes and spheres - Calculate volume of cubes and spheres - Express two values as a ratio - Enter data into a table - Interpret Tables - Create a graph - Describe the axis labels on graphs - Interpret graphs This material is based upon work supported by the National Science Foundation under Grant No. 1919613. Any opinions, findings, and conclusions or recommendations expressed in this material are those of the author(s) and do not necessarily reflect the views of the National Science Foundation.
No restrictions on your remixing, redistributing, or making derivative works. Give credit to the author, as required.
Your remixing, redistributing, or making derivatives works comes with some restrictions, including how it is shared.
Your redistributing comes with some restrictions. Do not remix or make derivative works.
Most restrictive license type. Prohibits most uses, sharing, and any changes.
Copyrighted materials, available under Fair Use and the TEACH Act for US-based educators, or other custom arrangements. Go to the resource provider to see their individual restrictions.


![The Perfect Brew: An Activity Demonstrating Cell Counting and Hemocytometer Use [version 1.0]](https://oercommons.org/static/newdesign/images/materials/default-thumbnail-index.png)