This resource links to both Measurement & Data progression documents published by the Common Core Writing Teams in June 2011.
- Material Type:
- Assessment
- Homework/Assignment
- Teaching/Learning Strategy
- Date Added:
- 05/09/2013

This resource links to both Measurement & Data progression documents published by the Common Core Writing Teams in June 2011.
This was created to introduce my adult students to the accessibility of Geometry and Measurement in the world around them. It can serve as a 1-day activity, or be split into several days. It was followed by a series of more in-depth lessons on shapes, angles, perimeter, area, and volume. Introducing each activity and stopping to discuss after each activity is necessary to helping students process the new information, encourage their latent knowledge, and reassure their uncertainties. Pair or group work is helpful, not only in encouraging weaker students to participate, but in creating greater group cohesion for more effective learning in the new unit.
Tools used: rulers, yard sticks, meter sticks, measuring tape, string w/2 pencils to create circles; styrofoam meat trays, cardboard and scissors to create 2-d shapes; calculators
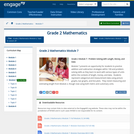
Module 7 presents an opportunity for students to practice addition and subtraction strategies within 100 and problem-solving skills as they learn to work with various types of units within the contexts of length, money, and data. Students represent categorical and measurement data using picture graphs, bar graphs, and line plots. They revisit measuring and estimating length from Module 2, though now using both metric and customary units.
Find the rest of the EngageNY Mathematics resources at https://archive.org/details/engageny-mathematics.
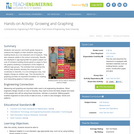
Students visit second- and fourth-grade classes to measure the heights of older students using large building blocks as a non-standard unit of measure. They also measure adults in the school community. Results are displayed in age-appropriate bar graphs (paper cut-outs of miniature building blocks glued on paper to form bar graphs) enabling a comparison of the heights of different age groups. The activities that comprise this activity help students develop the concepts and vocabulary to describe, in a non-ambiguous way, how heights change as children age. This introduction to graphing provides an important foundation for creating and interpreting graphs in future years.
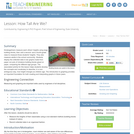
Kindergartners measure each other's height using large building blocks, then visit a 2nd and a 4th grade class to measure those students. They can also measure adults in the school community. Results are displayed in age-appropriate bar graphs (paper cut-outs of miniature building blocks glued on paper to form a bar graph) comparing the different age groups. The activities that comprise this lesson help students develop the concepts and vocabulary to describe, in a non-ambiguous way, how height changes as children get older. The introduction to graphing provides an important foundation for both creating and interpreting graphs in future years.
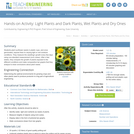
Students plant sunflower seeds in plastic cups, and once germinated, expose them to varying light or soil moisture conditions. They measure growth of the seedlings every few days using non-standard measurement (inch cubes). After a few weeks, they compare the growth of plants exposed to the different conditions and make bar comparative graphs, which they analyze to draw conclusions about the needs of plants.

(Nota: Esta es una traducción de un recurso educativo abierto creado por el Departamento de Educación del Estado de Nueva York (NYSED) como parte del proyecto "EngageNY" en 2013. Aunque el recurso real fue traducido por personas, la siguiente descripción se tradujo del inglés original usando Google Translate para ayudar a los usuarios potenciales a decidir si se adapta a sus necesidades y puede contener errores gramaticales o lingüísticos. La descripción original en inglés también se proporciona a continuación.)
El módulo 7 presenta una oportunidad para que los estudiantes practiquen estrategias de adición y sustracción dentro de 100 y habilidades de resolución de problemas a medida que aprenden a trabajar con varios tipos de unidades dentro de los contextos de longitud, dinero y datos. Los estudiantes representan datos categóricos y de medición utilizando gráficos de imágenes, gráficos de barras y parcelas de línea. Revisan la medición y la longitud de estimación del módulo 2, aunque ahora utilizan unidades métricas y habituales.
Encuentre el resto de los recursos matemáticos de Engageny en https://archive.org/details/engageny-mathematics.
English Description:
Module 7 presents an opportunity for students to practice addition and subtraction strategies within 100 and problem-solving skills as they learn to work with various types of units within the contexts of length, money, and data. Students represent categorical and measurement data using picture graphs, bar graphs, and line plots. They revisit measuring and estimating length from Module 2, though now using both metric and customary units.
Find the rest of the EngageNY Mathematics resources at https://archive.org/details/engageny-mathematics.

In this engaging unit, students will design and plant a square-foot garden that will be their central tool. Through the growing season, they will explore nutrition content in their everyday lives and see how it relates to what they are growing.
![OREGON MATH STANDARDS (2021): [2.GM]](https://img.oercommons.org/160x134/oercommons/media/courseware/lesson/image/13138_ODE_Math_Logo_2018-H_color_BvjqVNy.png)
The intent of clarifying statements is to provide additional guidance for educators to communicate the intent of the standard to support the future development of curricular resources and assessments aligned to the 2021 math standards. Clarifying statements can be in the form of succinct sentences or paragraphs that attend to one of four types of clarifications: (1) Student Experiences; (2) Examples; (3) Boundaries; and (4) Connection to Math Practices.