Information that has been collected through research. Research data management, metadata, data repositories, data citations, data sharing, data reuse, and more.
This webinar (recorded Sept. 27, 2017) introduces how to connect other services …
This webinar (recorded Sept. 27, 2017) introduces how to connect other services as add-ons to projects on the Open Science Framework (OSF; https://osf.io). Connecting services to your OSF projects via add-ons enables you to pull together the different parts of your research efforts without having to switch away from tools and workflows you wish to continue using. The OSF is a free, open source web application built to help researchers manage their workflows. The OSF is part collaboration tool, part version control software, and part data archive. The OSF connects to popular tools researchers already use, like Dropbox, Box, Github and Mendeley, to streamline workflows and increase efficiency.
This video will go over three issues that can arise when scientific …
This video will go over three issues that can arise when scientific studies have low statistical power. All materials shown in the video, as well as the content from our other videos, can be found here: https://osf.io/7gqsi/
Background All clinical research benefits from transparency and validity. Transparency and validity …
Background All clinical research benefits from transparency and validity. Transparency and validity of studies may increase by prospective registration of protocols and by publication of statistical analysis plans (SAPs) before data have been accessed to discern data-driven analyses from pre-planned analyses. Main message Like clinical trials, recommendations for SAPs for observational studies increase the transparency and validity of findings. We appraised the applicability of recently developed guidelines for the content of SAPs for clinical trials to SAPs for observational studies. Of the 32 items recommended for a SAP for a clinical trial, 30 items (94%) were identically applicable to a SAP for our observational study. Power estimations and adjustments for multiplicity are equally important in observational studies and clinical trials as both types of studies usually address multiple hypotheses. Only two clinical trial items (6%) regarding issues of randomisation and definition of adherence to the intervention did not seem applicable to observational studies. We suggest to include one new item specifically applicable to observational studies to be addressed in a SAP, describing how adjustment for possible confounders will be handled in the analyses. Conclusion With only few amendments, the guidelines for SAP of a clinical trial can be applied to a SAP for an observational study. We suggest SAPs should be equally required for observational studies and clinical trials to increase their transparency and validity.
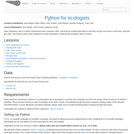
Python is a general purpose programming language that is useful for writing …
Python is a general purpose programming language that is useful for writing scripts to work effectively and reproducibly with data. This is an introduction to Python designed for participants with no programming experience. These lessons can be taught in one and a half days (~ 10 hours). They start with some basic information about Python syntax, the Jupyter notebook interface, and move through how to import CSV files, using the pandas package to work with data frames, how to calculate summary information from a data frame, and a brief introduction to plotting. The last lesson demonstrates how to work with databases directly from Python.
Data Carpentry lesson from Ecology curriculum to learn how to analyse and …
Data Carpentry lesson from Ecology curriculum to learn how to analyse and visualise ecological data in R. Data Carpentry’s aim is to teach researchers basic concepts, skills, and tools for working with data so that they can get more done in less time, and with less pain. The lessons below were designed for those interested in working with ecology data in R. This is an introduction to R designed for participants with no programming experience. These lessons can be taught in a day (~ 6 hours). They start with some basic information about R syntax, the RStudio interface, and move through how to import CSV files, the structure of data frames, how to deal with factors, how to add/remove rows and columns, how to calculate summary statistics from a data frame, and a brief introduction to plotting. The last lesson demonstrates how to work with databases directly from R.
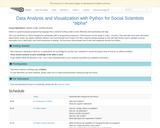
Python is a general purpose programming language that is useful for writing …
Python is a general purpose programming language that is useful for writing scripts to work effectively and reproducibly with data. This is an introduction to Python designed for participants with no programming experience. These lessons can be taught in a day (~ 6 hours). They start with some basic information about Python syntax, the Jupyter notebook interface, and move through how to import CSV files, using the pandas package to work with data frames, how to calculate summary information from a data frame, and a brief introduction to plotting. The last lesson demonstrates how to work with databases directly from Python.
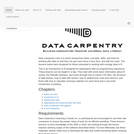
Data Carpentry trains researchers in the core data skills for efficient, shareable, …
Data Carpentry trains researchers in the core data skills for efficient, shareable, and reproducible research practices. We run accessible, inclusive training workshops; teach openly available, high-quality, domain-tailored lessons; and foster an active, inclusive, diverse instructor community that promotes and models reproducible research as a community norm.
The Biology Semester-long Course was developed and piloted at the University of …
The Biology Semester-long Course was developed and piloted at the University of Florida in Fall 2015. Course materials include readings, lectures, exercises, and assignments that expand on the material presented at workshops focusing on SQL and R.
A part of the data workflow is preparing the data for analysis. …
A part of the data workflow is preparing the data for analysis. Some of this involves data cleaning, where errors in the data are identified and corrected or formatting made consistent. This step must be taken with the same care and attention to reproducibility as the analysis. OpenRefine (formerly Google Refine) is a powerful free and open source tool for working with messy data: cleaning it and transforming it from one format into another. This lesson will teach you to use OpenRefine to effectively clean and format data and automatically track any changes that you make. Many people comment that this tool saves them literally months of work trying to make these edits by hand.
This Library Carpentry lesson introduces archivists to working with data. At the …
This Library Carpentry lesson introduces archivists to working with data. At the conclusion of the lesson you will: be able to explain terms, phrases, and concepts in code or software development; identify and use best practice in data structures; use regular expressions in searches.
Original data has become more accessible thanks to cultural and technological advances. …
Original data has become more accessible thanks to cultural and technological advances. On the internet, we can find innumerable data sets from sources such as scientific journals and repositories, local and national governments, and non-governmental organisations. Often, these data may be presented in novel ways, by creating new tables or plots, or by integrating additional data. Free, open-source software has become a great companion for open data. This open scholarship project offers free workshops and coding meet-ups (hackathons) to learn and practise data presentation, across the UK. It is made possible by a fellowship of the Software Sustainability Institute.
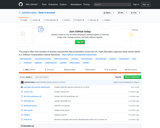
Databases are useful for both storing and using data effectively. Using a …
Databases are useful for both storing and using data effectively. Using a relational database serves several purposes. It keeps your data separate from your analysis. This means there’s no risk of accidentally changing data when you analyze it. If we get new data we can rerun a query to find all the data that meets certain criteria. It’s fast, even for large amounts of data. It improves quality control of data entry (type constraints and use of forms in Access, Filemaker, etc.) The concepts of relational database querying are core to understanding how to do similar things using programming languages such as R or Python. This lesson will teach you what relational databases are, how you can load data into them and how you can query databases to extract just the information that you need.
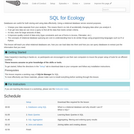
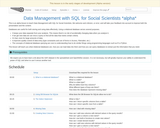
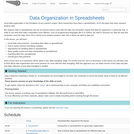
This is an alpha lesson to teach Data Management with SQL for …
This is an alpha lesson to teach Data Management with SQL for Social Scientists, We welcome and criticism, or error; and will take your feedback into account to improve both the presentation and the content. Databases are useful for both storing and using data effectively. Using a relational database serves several purposes. It keeps your data separate from your analysis. This means there’s no risk of accidentally changing data when you analyze it. If we get new data we can rerun a query to find all the data that meets certain criteria. It’s fast, even for large amounts of data. It improves quality control of data entry (type constraints and use of forms in Access, Filemaker, etc.) The concepts of relational database querying are core to understanding how to do similar things using programming languages such as R or Python. This lesson will teach you what relational databases are, how you can load data into them and how you can query databases to extract just the information that you need.
Good data organization is the foundation of any research project. Most researchers …
Good data organization is the foundation of any research project. Most researchers have data in spreadsheets, so it’s the place that many research projects start. We organize data in spreadsheets in the ways that we as humans want to work with the data, but computers require that data be organized in particular ways. In order to use tools that make computation more efficient, such as programming languages like R or Python, we need to structure our data the way that computers need the data. Since this is where most research projects start, this is where we want to start too! In this lesson, you will learn: Good data entry practices - formatting data tables in spreadsheets How to avoid common formatting mistakes Approaches for handling dates in spreadsheets Basic quality control and data manipulation in spreadsheets Exporting data from spreadsheets In this lesson, however, you will not learn about data analysis with spreadsheets. Much of your time as a researcher will be spent in the initial ‘data wrangling’ stage, where you need to organize the data to perform a proper analysis later. It’s not the most fun, but it is necessary. In this lesson you will learn how to think about data organization and some practices for more effective data wrangling. With this approach you can better format current data and plan new data collection so less data wrangling is needed.
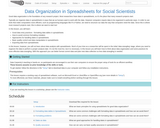
Lesson on spreadsheets for social scientists. Good data organization is the foundation …
Lesson on spreadsheets for social scientists. Good data organization is the foundation of any research project. Most researchers have data in spreadsheets, so it’s the place that many research projects start. Typically we organize data in spreadsheets in ways that we as humans want to work with the data. However computers require data to be organized in particular ways. In order to use tools that make computation more efficient, such as programming languages like R or Python, we need to structure our data the way that computers need the data. Since this is where most research projects start, this is where we want to start too! In this lesson, you will learn: Good data entry practices - formatting data tables in spreadsheets How to avoid common formatting mistakes Approaches for handling dates in spreadsheets Basic quality control and data manipulation in spreadsheets Exporting data from spreadsheets In this lesson, however, you will not learn about data analysis with spreadsheets. Much of your time as a researcher will be spent in the initial ‘data wrangling’ stage, where you need to organize the data to perform a proper analysis later. It’s not the most fun, but it is necessary. In this lesson you will learn how to think about data organization and some practices for more effective data wrangling. With this approach you can better format current data and plan new data collection so less data wrangling is needed.
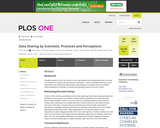
Background Scientific research in the 21st century is more data intensive and …
Background Scientific research in the 21st century is more data intensive and collaborative than in the past. It is important to study the data practices of researchers – data accessibility, discovery, re-use, preservation and, particularly, data sharing. Data sharing is a valuable part of the scientific method allowing for verification of results and extending research from prior results. Methodology/Principal Findings A total of 1329 scientists participated in this survey exploring current data sharing practices and perceptions of the barriers and enablers of data sharing. Scientists do not make their data electronically available to others for various reasons, including insufficient time and lack of funding. Most respondents are satisfied with their current processes for the initial and short-term parts of the data or research lifecycle (collecting their research data; searching for, describing or cataloging, analyzing, and short-term storage of their data) but are not satisfied with long-term data preservation. Many organizations do not provide support to their researchers for data management both in the short- and long-term. If certain conditions are met (such as formal citation and sharing reprints) respondents agree they are willing to share their data. There are also significant differences and approaches in data management practices based on primary funding agency, subject discipline, age, work focus, and world region. Conclusions/Significance Barriers to effective data sharing and preservation are deeply rooted in the practices and culture of the research process as well as the researchers themselves. New mandates for data management plans from NSF and other federal agencies and world-wide attention to the need to share and preserve data could lead to changes. Large scale programs, such as the NSF-sponsored DataNET (including projects like DataONE) will both bring attention and resources to the issue and make it easier for scientists to apply sound data management principles.
Data Carpentry lesson to learn how to use command-line tools to perform …
Data Carpentry lesson to learn how to use command-line tools to perform quality control, align reads to a reference genome, and identify and visualize between-sample variation. A lot of genomics analysis is done using command-line tools for three reasons: 1) you will often be working with a large number of files, and working through the command-line rather than through a graphical user interface (GUI) allows you to automate repetitive tasks, 2) you will often need more compute power than is available on your personal computer, and connecting to and interacting with remote computers requires a command-line interface, and 3) you will often need to customize your analyses, and command-line tools often enable more customization than the corresponding GUI tools (if in fact a GUI tool even exists). In a previous lesson, you learned how to use the bash shell to interact with your computer through a command line interface. In this lesson, you will be applying this new knowledge to carry out a common genomics workflow - identifying variants among sequencing samples taken from multiple individuals within a population. We will be starting with a set of sequenced reads (.fastq files), performing some quality control steps, aligning those reads to a reference genome, and ending by identifying and visualizing variations among these samples. As you progress through this lesson, keep in mind that, even if you aren’t going to be doing this same workflow in your research, you will be learning some very important lessons about using command-line bioinformatic tools. What you learn here will enable you to use a variety of bioinformatic tools with confidence and greatly enhance your research efficiency and productivity.
Access to data is a critical feature of an efficient, progressive and …
Access to data is a critical feature of an efficient, progressive and ultimately self-correcting scientific ecosystem. But the extent to which in-principle benefits of data sharing are realized in practice is unclear. Crucially, it is largely unknown whether published findings can be reproduced by repeating reported analyses upon shared data (‘analytic reproducibility’). To investigate this, we conducted an observational evaluation of a mandatory open data policy introduced at the journal Cognition. Interrupted time-series analyses indicated a substantial post-policy increase in data available statements (104/417, 25% pre-policy to 136/174, 78% post-policy), although not all data appeared reusable (23/104, 22% pre-policy to 85/136, 62%, post-policy). For 35 of the articles determined to have reusable data, we attempted to reproduce 1324 target values. Ultimately, 64 values could not be reproduced within a 10% margin of error. For 22 articles all target values were reproduced, but 11 of these required author assistance. For 13 articles at least one value could not be reproduced despite author assistance. Importantly, there were no clear indications that original conclusions were seriously impacted. Mandatory open data policies can increase the frequency and quality of data sharing. However, suboptimal data curation, unclear analysis specification and reporting errors can impede analytic reproducibility, undermining the utility of data sharing and the credibility of scientific findings.
No restrictions on your remixing, redistributing, or making derivative works. Give credit to the author, as required.
Your remixing, redistributing, or making derivatives works comes with some restrictions, including how it is shared.
Your redistributing comes with some restrictions. Do not remix or make derivative works.
Most restrictive license type. Prohibits most uses, sharing, and any changes.
Copyrighted materials, available under Fair Use and the TEACH Act for US-based educators, or other custom arrangements. Go to the resource provider to see their individual restrictions.