Updating search results...

Reproducibility

Agreement of research results repeated. Reproducibility, replicability, repeatability, robustness, generalizability, organization, documentation, automation, dissemination, guidance, definitions, and more.

183 affiliated resources

Search Resources

View
Selected filters:
Optimizing Research Collaboration
Unrestricted Use
CC BY
Rating
0.0 stars

In this webinar, we demonstrate the OSF tools available for contributors, labs, centers, and institutions that support stronger collaborations. The demo includes useful practices like: contributor management, the OSF wiki as an electronic lab notebook, using OSF to manage online courses and syllabi, and more. Finally, we look at how OSF Institutions can provide discovery and intelligence gathering infrastructure so that you can focus on conducting and supporting exceptional research. The Center for Open Science’s ongoing mission is to provide community and technical resources to support your commitments to rigorous, transparent research practices. Visit cos.io/institutions to learn more.

Subject:
Applied Science
Computer Science
Information Science
Material Type:
Lecture
Provider:
Center for Open Science
Author:
Center for Open Science
Date Added:
08/07/2020
Outcome reporting bias in randomized-controlled trials investigating antipsychotic drugs
Unrestricted Use
CC BY
Rating
0.0 stars

Recent literature hints that outcomes of clinical trials in medicine are selectively reported. If applicable to psychotic disorders, such bias would jeopardize the reliability of randomized clinical trials (RCTs) investigating antipsychotics and thus their extrapolation to clinical practice. We therefore comprehensively examined outcome reporting bias in RCTs of antipsychotic drugs by a systematic review of prespecified outcomes on ClinicalTrials.gov records of RCTs investigating antipsychotic drugs in schizophrenia and schizoaffective disorder between 1 January 2006 and 31 December 2013. These outcomes were compared with outcomes published in scientific journals. Our primary outcome measure was concordance between prespecified and published outcomes; secondary outcome measures included outcome modifications on ClinicalTrials.gov after trial inception and the effects of funding source and directionality of results on record adherence. Of the 48 RCTs, 85% did not fully adhere to the prespecified outcomes. Discrepancies between prespecified and published outcomes were found in 23% of RCTs for primary outcomes, whereas 81% of RCTs had at least one secondary outcome non-reported, newly introduced, or changed to a primary outcome in the respective publication. In total, 14% of primary and 44% of secondary prespecified outcomes were modified after trial initiation. Neither funding source (P=0.60) nor directionality of the RCT results (P=0.10) impacted ClinicalTrials.gov record adherence. Finally, the number of published safety endpoints (N=335) exceeded the number of prespecified safety outcomes by 5.5 fold. We conclude that RCTs investigating antipsychotic drugs suffer from substantial outcome reporting bias and offer suggestions to both monitor and limit such bias in the future.

Subject:
Applied Science
Health, Medicine and Nursing
Material Type:
Reading
Provider:
Translational Psychiatry
Author:
C. H. Vinkers
C. M. C. Lemmens
J. J. Luykx
M. Lancee
R. S. Kahn
Date Added:
08/07/2020
Plotting and Programming in Python
Unrestricted Use
CC BY
Rating
0.0 stars

This lesson is part of Software Carpentry workshops and teach an introduction to plotting and programming using python. This lesson is an introduction to programming in Python for people with little or no previous programming experience. It uses plotting as its motivating example, and is designed to be used in both Data Carpentry and Software Carpentry workshops. This lesson references JupyterLab, but can be taught using a regular Python interpreter as well. Please note that this lesson uses Python 3 rather than Python 2.

Subject:
Applied Science
Computer Science
Information Science
Mathematics
Measurement and Data
Material Type:
Module
Provider:
The Carpentries
Author:
Adam Steer
Allen Lee
Andreas Hilboll
Ashley Champagne
Benjamin
Benjamin Roberts
CanWood
Carlos Henrique Brandt
Carlos M Ortiz Marrero
Cephalopd
Cian Wilson
Dan Mønster
Daniel W Kerchner
Daria Orlowska
Dave Lampert
David Matten
Erin Alison Becker
Florian Goth
Francisco J. Martínez
Greg Wilson
Jacob Deppen
Jarno Rantaharju
Jeremy Zucker
Jonah Duckles
Kees den Heijer
Keith Gilbertson
Kyle E Niemeyer
Lex Nederbragt
Logan Cox
Louis Vernon
Lucy Dorothy Whalley
Madeleine Bonsma-Fisher
Mark Phillips
Mark Slater
Maxim Belkin
Michael Beyeler
Mike Henry
Narayanan Raghupathy
Nigel Bosch
Olav Vahtras
Pablo Hernandez-Cerdan
Paul Anzel
Phil Tooley
Raniere Silva
Robert Woodward
Ryan Avery
Ryan Gregory James
SBolo
Sarah M Brown
Shyam Dwaraknath
Sourav Singh
Steven Koenig
Stéphane Guillou
Taylor Smith
Thor Wikfeldt
Timothy Warren
Tyler Martin
Vasu Venkateshwaran
Vikas Pejaver
ian
mzc9
Date Added:
08/07/2020
Preparing code and data for computationally reproducible collaboration and publication: a hands-on workshop
Unrestricted Use
CC BY
Rating
0.0 stars

Computational analyses are playing an increasingly central role in research. Journals, funders, and researchers are calling for published research to include associated data and code. However, many involved in research have not received training in best practices and tools for sharing code and data. This course aims to address this gap in training while also providing those who support researchers with curated best practices guidance and tools.This course is unique compared to other reproducibility courses due to its practical, step-by-step design. It is comprised of hands-on exercises to prepare research code and data for computationally reproducible publication. Although the course starts with some brief introductory information about computational reproducibility, the bulk of the course is guided work with data and code. Participants move through preparing research for reuse, organization, documentation, automation, and submitting their code and data to share. Tools that support reproducibility will be introduced (Code Ocean), but all lessons will be platform agnostic.Level: IntermediateIntended audience: The course is targeted at researchers and research support staff who are involved in the preparation and publication of research materials. Anyone with an interest in reproducible publication is welcome. The course is especially useful for those looking to learn practical steps for improving the computational reproducibility of their own research.

Subject:
Applied Science
Life Science
Physical Science
Social Science
Material Type:
Activity/Lab
Provider:
April Clyburne-Sherin
Author:
April Clyburne-Sherin
Date Added:
08/08/2019
The Preregistration Challenge: A How To Guide
Unrestricted Use
CC BY
Rating
0.0 stars

This video shows interested researchers how to get started on their own preregistration as part of the Preregistration Challenge. Learn how to create a new draft, find example preregistrations from different fields, respond to comments from the preregistration review team, and turn your final draft into a formal preregistration. For more information, check out https://www.cos.io/initiatives/prereg-more-information.

Subject:
Education
Material Type:
Lesson
Provider:
Center for Open Science
Date Added:
03/31/2021
Preregistration: Improve Research Rigor, Reduce Bias
Unrestricted Use
CC BY
Rating
0.0 stars

In this webinar Professor Brian Nosek, Executive Director of the Center for Open Science (https://cos.io), outlines the practice of Preregistration and how it can aid in increasing the rigor and reproducibility of research. The webinar is co-hosted by the Health Research Alliance, a collaborative member organization of nonprofit research funders. Slides available at: https://osf.io/9m6tx/

Subject:
Applied Science
Computer Science
Information Science
Material Type:
Lecture
Provider:
Center for Open Science
Author:
Center for Open Science
Date Added:
08/07/2020
Preregistration Overview page
Unrestricted Use
CC BY
Rating
0.0 stars

What is Preregistration? When you preregister your research, you're simply specifying your research plan in advance of your study and submitting it to a registry. Preregistration separates hypothesis-generating (exploratory) from hypothesis-testing (confirmatory) research. Both are important. But the same data cannot be used to generate and test a hypothesis, which can happen unintentionally and reduce the credibility of your results. Addressing this problem through planning improves the quality and transparency of your research. This helps you clearly report your study and helps others who may wish to build on it.

Subject:
Applied Science
Life Science
Physical Science
Social Science
Material Type:
Reading
Provider:
Center for Open Science
Author:
Center for Open Science
Date Added:
06/18/2020
Preregistration in Complex Contexts: A Preregistration Template for the Application of Cognitive Models
Unrestricted Use
CC BY
Rating
0.0 stars

In recent years, open science practices have become increasingly popular in psychology and related sciences. These practices aim to increase rigour and transparency in science as a potential response to the challenges posed by the replication crisis. Many of these reforms -- including the highly influential preregistration -- have been designed for experimental work that tests simple hypotheses with standard statistical analyses, such as assessing whether an experimental manipulation has an effect on a variable of interest. However, psychology is a diverse field of research, and the somewhat narrow focus of the prevalent discussions surrounding and templates for preregistration has led to debates on how appropriate these reforms are for areas of research with more diverse hypotheses and more complex methods of analysis, such as cognitive modelling research within mathematical psychology. Our article attempts to bridge the gap between open science and mathematical psychology, focusing on the type of cognitive modelling that Crüwell, Stefan, & Evans (2019) labelled model application, where researchers apply a cognitive model as a measurement tool to test hypotheses about parameters of the cognitive model. Specifically, we (1) discuss several potential researcher degrees of freedom within model application, (2) provide the first preregistration template for model application, and (3) provide an example of a preregistered model application using our preregistration template. More broadly, we hope that our discussions and proposals constructively advance the debate surrounding preregistration in cognitive modelling, and provide a guide for how preregistration templates may be developed in other diverse or complex research contexts.

Subject:
Applied Science
Life Science
Physical Science
Social Science
Material Type:
Reading
Author:
Nathan Evans
Sophia Crüwell
Date Added:
12/07/2019
Programming with MATLAB
Unrestricted Use
CC BY
Rating
0.0 stars

The best way to learn how to program is to do something useful, so this introduction to MATLAB is built around a common scientific task: data analysis. Our real goal isn’t to teach you MATLAB, but to teach you the basic concepts that all programming depends on. We use MATLAB in our lessons because: we have to use something for examples; it’s well-documented; it has a large (and growing) user base among scientists in academia and industry; and it has a large library of packages available for performing diverse tasks. But the two most important things are to use whatever language your colleagues are using, so that you can share your work with them easily, and to use that language well.

Subject:
Applied Science
Computer Science
Information Science
Mathematics
Measurement and Data
Material Type:
Module
Provider:
The Carpentries
Author:
Gerard Capes
Date Added:
03/20/2017
Programming with Python
Unrestricted Use
CC BY
Rating
0.0 stars

The best way to learn how to program is to do something useful, so this introduction to Python is built around a common scientific task: data analysis. Arthritis Inflammation We are studying inflammation in patients who have been given a new treatment for arthritis, and need to analyze the first dozen data sets of their daily inflammation. The data sets are stored in comma-separated values (CSV) format: each row holds information for a single patient, columns represent successive days. The first three rows of our first file look like this: 0,0,1,3,1,2,4,7,8,3,3,3,10,5,7,4,7,7,12,18,6,13,11,11,7,7,4,6,8,8,4,4,5,7,3,4,2,3,0,0 0,1,2,1,2,1,3,2,2,6,10,11,5,9,4,4,7,16,8,6,18,4,12,5,12,7,11,5,11,3,3,5,4,4,5,5,1,1,0,1 0,1,1,3,3,2,6,2,5,9,5,7,4,5,4,15,5,11,9,10,19,14,12,17,7,12,11,7,4,2,10,5,4,2,2,3,2,2,1,1 Each number represents the number of inflammation bouts that a particular patient experienced on a given day. For example, value “6” at row 3 column 7 of the data set above means that the third patient was experiencing inflammation six times on the seventh day of the clinical study. So, we want to: Calculate the average inflammation per day across all patients. Plot the result to discuss and share with colleagues. To do all that, we’ll have to learn a little bit about programming.

Subject:
Applied Science
Computer Science
Information Science
Mathematics
Measurement and Data
Material Type:
Module
Provider:
The Carpentries
Author:
Anne Fouilloux
Lauren Ko
Maxim Belkin
Trevor Bekolay
Valentina Staneva
Date Added:
08/07/2020
Programming with R
Unrestricted Use
CC BY
Rating
0.0 stars

The best way to learn how to program is to do something useful, so this introduction to R is built around a common scientific task: data analysis. Our real goal isn’t to teach you R, but to teach you the basic concepts that all programming depends on. We use R in our lessons because: we have to use something for examples; it’s free, well-documented, and runs almost everywhere; it has a large (and growing) user base among scientists; and it has a large library of external packages available for performing diverse tasks. But the two most important things are to use whatever language your colleagues are using, so you can share your work with them easily, and to use that language well. We are studying inflammation in patients who have been given a new treatment for arthritis, and need to analyze the first dozen data sets of their daily inflammation. The data sets are stored in CSV format (comma-separated values): each row holds information for a single patient, and the columns represent successive days. The first few rows of our first file look like this: 0,0,1,3,1,2,4,7,8,3,3,3,10,5,7,4,7,7,12,18,6,13,11,11,7,7,4,6,8,8,4,4,5,7,3,4,2,3,0,0 0,1,2,1,2,1,3,2,2,6,10,11,5,9,4,4,7,16,8,6,18,4,12,5,12,7,11,5,11,3,3,5,4,4,5,5,1,1,0,1 0,1,1,3,3,2,6,2,5,9,5,7,4,5,4,15,5,11,9,10,19,14,12,17,7,12,11,7,4,2,10,5,4,2,2,3,2,2,1,1 0,0,2,0,4,2,2,1,6,7,10,7,9,13,8,8,15,10,10,7,17,4,4,7,6,15,6,4,9,11,3,5,6,3,3,4,2,3,2,1 0,1,1,3,3,1,3,5,2,4,4,7,6,5,3,10,8,10,6,17,9,14,9,7,13,9,12,6,7,7,9,6,3,2,2,4,2,0,1,1 We want to: load that data into memory, calculate the average inflammation per day across all patients, and plot the result. To do all that, we’ll have to learn a little bit about programming.

Subject:
Applied Science
Computer Science
Information Science
Mathematics
Measurement and Data
Material Type:
Module
Provider:
The Carpentries
Author:
Diya Das
Katrin Leinweber
Rohit Goswami
Date Added:
03/20/2017
Project Organization and Management for Genomics
Unrestricted Use
CC BY
Rating
0.0 stars

Data Carpentry Genomics workshop lesson to learn how to structure your metadata, organize and document your genomics data and bioinformatics workflow, and access data on the NCBI sequence read archive (SRA) database. Good data organization is the foundation of any research project. It not only sets you up well for an analysis, but it also makes it easier to come back to the project later and share with collaborators, including your most important collaborator - future you. Organizing a project that includes sequencing involves many components. There’s the experimental setup and conditions metadata, measurements of experimental parameters, sequencing preparation and sample information, the sequences themselves and the files and workflow of any bioinformatics analysis. So much of the information of a sequencing project is digital, and we need to keep track of our digital records in the same way we have a lab notebook and sample freezer. In this lesson, we’ll go through the project organization and documentation that will make an efficient bioinformatics workflow possible. Not only will this make you a more effective bioinformatics researcher, it also prepares your data and project for publication, as grant agencies and publishers increasingly require this information. In this lesson, we’ll be using data from a study of experimental evolution using E. coli. More information about this dataset is available here. In this study there are several types of files: Spreadsheet data from the experiment that tracks the strains and their phenotype over time Spreadsheet data with information on the samples that were sequenced - the names of the samples, how they were prepared and the sequencing conditions The sequence data Throughout the analysis, we’ll also generate files from the steps in the bioinformatics pipeline and documentation on the tools and parameters that we used. In this lesson you will learn: How to structure your metadata, tabular data and information about the experiment. The metadata is the information about the experiment and the samples you’re sequencing. How to prepare for, understand, organize and store the sequencing data that comes back from the sequencing center How to access and download publicly available data that may need to be used in your bioinformatics analysis The concepts of organizing the files and documenting the workflow of your bioinformatics analysis

Subject:
Business and Communication
Genetics
Life Science
Management
Material Type:
Module
Provider:
The Carpentries
Author:
Amanda Charbonneau
Bérénice Batut
Daniel O. S. Ouso
Deborah Paul
Erin Alison Becker
François Michonneau
Jason Williams
Juan A. Ugalde
Kevin Weitemier
Laura Williams
Paula Andrea Martinez
Peter R. Hoyt
Rayna Michelle Harris
Taylor Reiter
Toby Hodges
Tracy Teal
Date Added:
08/07/2020
PsyTeachR
Conditional Remix & Share Permitted
CC BY-SA
Rating
0.0 stars

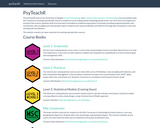
Materials for the University of Glasgow Institute of Neuroscience and Psychology’s undergraduate and MSc methods courses + Experiences, insights, and materials for teaching R across all undergraduate and postgraduate levels.

Subject:
Psychology
Social Science
Material Type:
Textbook
Provider:
University of Glasgow
Date Added:
06/18/2020
Public Availability of Published Research Data in High-Impact Journals
Unrestricted Use
CC BY
Rating
0.0 stars

Background There is increasing interest to make primary data from published research publicly available. We aimed to assess the current status of making research data available in highly-cited journals across the scientific literature. Methods and Results We reviewed the first 10 original research papers of 2009 published in the 50 original research journals with the highest impact factor. For each journal we documented the policies related to public availability and sharing of data. Of the 50 journals, 44 (88%) had a statement in their instructions to authors related to public availability and sharing of data. However, there was wide variation in journal requirements, ranging from requiring the sharing of all primary data related to the research to just including a statement in the published manuscript that data can be available on request. Of the 500 assessed papers, 149 (30%) were not subject to any data availability policy. Of the remaining 351 papers that were covered by some data availability policy, 208 papers (59%) did not fully adhere to the data availability instructions of the journals they were published in, most commonly (73%) by not publicly depositing microarray data. The other 143 papers that adhered to the data availability instructions did so by publicly depositing only the specific data type as required, making a statement of willingness to share, or actually sharing all the primary data. Overall, only 47 papers (9%) deposited full primary raw data online. None of the 149 papers not subject to data availability policies made their full primary data publicly available. Conclusion A substantial proportion of original research papers published in high-impact journals are either not subject to any data availability policies, or do not adhere to the data availability instructions in their respective journals. This empiric evaluation highlights opportunities for improvement.

Subject:
Applied Science
Health, Medicine and Nursing
Material Type:
Reading
Provider:
PLOS ONE
Author:
Alawi A. Alsheikh-Ali
John P. A. Ioannidis
Mouaz H. Al-Mallah
Waqas Qureshi
Date Added:
08/07/2020
Public Data Archiving in Ecology and Evolution: How Well Are We Doing?
Unrestricted Use
CC BY
Rating
0.0 stars

Policies that mandate public data archiving (PDA) successfully increase accessibility to data underlying scientific publications. However, is the data quality sufficient to allow reuse and reanalysis? We surveyed 100 datasets associated with nonmolecular studies in journals that commonly publish ecological and evolutionary research and have a strong PDA policy. Out of these datasets, 56% were incomplete, and 64% were archived in a way that partially or entirely prevented reuse. We suggest that cultural shifts facilitating clearer benefits to authors are necessary to achieve high-quality PDA and highlight key guidelines to help authors increase their data’s reuse potential and compliance with journal data policies.

Subject:
Biology
Life Science
Material Type:
Reading
Provider:
PLOS Biology
Author:
Dominique G. Roche
Loeske E. B. Kruuk
Robert Lanfear
Sandra A. Binning
Date Added:
08/07/2020
Python for Humanities
Unrestricted Use
CC BY
Rating
0.0 stars

Python is a general purpose programming language that is useful for writing scripts to work effectively and reproducibly with data. This is an introduction to Python designed for participants with no programming experience. These lessons can be taught in a day (~ 6 hours). They start with some basic information about Python syntax, the Jupyter notebook interface, and move through how to import CSV files, using the pandas package to work with data frames, how to calculate summary information from a data frame, and a brief introduction to plotting. The last lesson demonstrates how to work with databases directly from Python.

Subject:
Applied Science
Computer Science
Information Science
Mathematics
Measurement and Data
Material Type:
Module
Provider:
The Carpentries
Author:
Iain Emsley
Date Added:
08/07/2020
Questionable research practices among italian research psychologists
Unrestricted Use
CC BY
Rating
0.0 stars

A survey in the United States revealed that an alarmingly large percentage of university psychologists admitted having used questionable research practices that can contaminate the research literature with false positive and biased findings. We conducted a replication of this study among Italian research psychologists to investigate whether these findings generalize to other countries. All the original materials were translated into Italian, and members of the Italian Association of Psychology were invited to participate via an online survey. The percentages of Italian psychologists who admitted to having used ten questionable research practices were similar to the results obtained in the United States although there were small but significant differences in self-admission rates for some QRPs. Nearly all researchers (88%) admitted using at least one of the practices, and researchers generally considered a practice possibly defensible if they admitted using it, but Italian researchers were much less likely than US researchers to consider a practice defensible. Participants’ estimates of the percentage of researchers who have used these practices were greater than the self-admission rates, and participants estimated that researchers would be unlikely to admit it. In written responses, participants argued that some of these practices are not questionable and they have used some practices because reviewers and journals demand it. The similarity of results obtained in the United States, this study, and a related study conducted in Germany suggest that adoption of these practices is an international phenomenon and is likely due to systemic features of the international research and publication processes.

Subject:
Psychology
Social Science
Material Type:
Reading
Provider:
PLOS ONE
Author:
Coosje L. S. Veldkamp
Franca Agnoli
Jelte M. Wicherts
Paolo Albiero
Roberto Cubelli
Date Added:
08/07/2020
RStudio Cheatsheets
Unrestricted Use
CC BY
Rating
0.0 stars

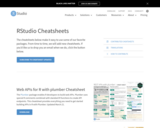
RStudio Cheatsheets

The cheatsheets below make it easy to use some of our favorite packages. Cheatsheets include the following topics:

Python with R and Reticulate Cheatsheet
The reticulate package provides a comprehensive set of tools for interoperability between Python and R. With reticulate, you can call Python from R in a variety of ways including importing Python modules into R scripts, writing R Markdown Python chunks, sourcing Python scripts, and using Python interactively within the RStudio IDE. This cheatsheet will remind you how.

Factors with forcats Cheatsheet
Factors are R’s data structure for categorical data. The forcats package makes it easy to work with factors. This cheatsheet reminds you how to make factors, reorder their levels, recode their values, and more.

Tidy Evaluation with rlang Cheatsheet
Tidy Evaluation (Tidy Eval) is a framework for doing non-standard evaluation in R that makes it easier to program with tidyverse functions. Non-standard evaluation, better thought of as “delayed evaluation,” lets you capture a user’s R code to run later in a new environment or against a new data frame. The tidy evaluation framework is implemented by the rlang package and used by functions throughout the tidyverse.

Deep Learning with Keras Cheatsheet
Keras is a high-level neural networks API developed with a focus on enabling fast experimentation. Keras supports both convolution based networks and recurrent networks (as well as combinations of the two), runs seamlessly on both CPU and GPU devices, and is capable of running on top of multiple back-ends including TensorFlow, CNTK, and Theano.

Dates and Times Cheatsheet
Lubridate makes it easier to work with dates and times in R. This lubridate cheatsheet covers how to round dates, work with time zones, extract elements of a date or time, parse dates into R and more. The back of the cheatsheet describes lubridate’s three timespan classes: periods, durations, and intervals; and explains how to do math with date-times.

Work with Strings Cheatsheet
The stringr package provides an easy to use toolkit for working with strings, i.e. character data, in R. This cheatsheet guides you through stringr’s functions for manipulating strings. The back page provides a concise reference to regular expresssions, a mini-language for describing, finding, and matching patterns in strings.

Apply Functions Cheatsheet
The purrr package makes it easy to work with lists and functions. This cheatsheet will remind you how to manipulate lists with purrr as well as how to apply functions iteratively to each element of a list or vector. The back of the cheatsheet explains how to work with list-columns. With list columns, you can use a simple data frame to organize any collection of objects in R.

Data Import Cheatsheet
The Data Import cheatsheet reminds you how to read in flat files with http://readr.tidyverse.org/, work with the results as tibbles, and reshape messy data with tidyr. Use tidyr to reshape your tables into tidy data, the data format that works the most seamlessly with R and the tidyverse.

Data Transformation Cheatsheet
dplyr provides a grammar for manipulating tables in R. This cheatsheet will guide you through the grammar, reminding you how to select, filter, arrange, mutate, summarise, group, and join data frames and tibbles.

Sparklyr Cheatsheet
Sparklyr provides an R interface to Apache Spark, a fast and general engine for processing Big Data. With sparklyr, you can connect to a local or remote Spark session, use dplyr to manipulate data in Spark, and run Spark’s built in machine learning algorithms.

R Markdown Cheatsheet
R Markdown is an authoring format that makes it easy to write reusable reports with R. You combine your R code with narration written in markdown (an easy-to-write plain text format) and then export the results as an html, pdf, or Word file. You can even use R Markdown to build interactive documents and slideshows.

RStudio IDE Cheatsheet
The RStudio IDE is the most popular integrated development environment for R. Do you want to write, run, and debug your own R code? Work collaboratively on R projects with version control? Build packages or create documents and apps? No matter what you do with R, the RStudio IDE can help you do it faster. This cheatsheet will guide you through the most useful features of the IDE, as well as the long list of keyboard shortcuts built into the RStudio IDE.

Shiny Cheatsheet
If you’re ready to build interactive web apps with R, say hello to Shiny. This cheatsheet provides a tour of the Shiny package and explains how to build and customize an interactive app. Be sure to follow the links on the sheet for even more information.

Data Visualization Cheatsheet
The ggplot2 package lets you make beautiful and customizable plots of your data. It implements the grammar of graphics, an easy to use system for building plots. See docs.ggplot2.org for detailed examples.

Package Development Cheatsheet
The devtools package makes it easy to build your own R packages, and packages make it easy to share your R code. Supplement this cheatsheet with r-pkgs.had.co.nz, Hadley’s book on package development.

Subject:
Applied Science
Life Science
Physical Science
Social Science
Material Type:
Student Guide
Provider:
RStudio
Author:
RStudio
Date Added:
08/07/2020
Raiders of the lost HARK: a reproducible inference framework for big data science
Unrestricted Use
CC BY
Rating
0.0 stars

Hypothesizing after the results are known (HARK) has been disparaged as data dredging, and safeguards including hypothesis preregistration and statistically rigorous oversight have been recommended. Despite potential drawbacks, HARK has deepened thinking about complex causal processes. Some of the HARK precautions can conflict with the modern reality of researchers’ obligations to use big, ‘organic’ data sources—from high-throughput genomics to social media streams. We here propose a HARK-solid, reproducible inference framework suitable for big data, based on models that represent formalization of hypotheses. Reproducibility is attained by employing two levels of model validation: internal (relative to data collated around hypotheses) and external (independent to the hypotheses used to generate data or to the data used to generate hypotheses). With a model-centered paradigm, the reproducibility focus changes from the ability of others to reproduce both data and specific inferences from a study to the ability to evaluate models as representation of reality. Validation underpins ‘natural selection’ in a knowledge base maintained by the scientific community. The community itself is thereby supported to be more productive in generating and critically evaluating theories that integrate wider, complex systems.

Subject:
Applied Science
Health, Medicine and Nursing
Material Type:
Reading
Provider:
Palgrave Communications
Author:
Iain E. Buchan
James S. Koopman
Jiang Bian
Matthew Sperrin
Mattia Prosperi
Mo Wang
Date Added:
08/07/2020