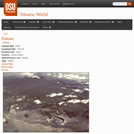
This page from the Volcano World website contains a summary account of …
This page from the Volcano World website contains a summary account of the 1959 eruption at Kilauea Iki which is illustrated by photographs and videos.
An exercise on the effects of flooding that took place in the …
An exercise on the effects of flooding that took place in the upper Mississippi River drainage basin in 1993, using before and after satellite images.
(Note: this resource was added to OER Commons as part of a batch upload of over 2,200 records. If you notice an issue with the quality of the metadata, please let us know by using the 'report' button and we will flag it for consideration.)
Analyze the effect of a 1996 controlled flood on a sandbar in …
Analyze the effect of a 1996 controlled flood on a sandbar in Grand Canyon. This exercise uses Spatial Analyst and 3D Analyst.
(Note: this resource was added to OER Commons as part of a batch upload of over 2,200 records. If you notice an issue with the quality of the metadata, please let us know by using the 'report' button and we will flag it for consideration.)
This is a problem-based learning (PBL) group jigsaw activity. The scenario is: …
This is a problem-based learning (PBL) group jigsaw activity. The scenario is: Students are employees of a unit of the United Nations responsible for coordinating disaster relief after a major disaster (the 2004 Asian Earthquake and Tsunami) occurs. The agency needs to understand the situation in each country so that it can coordinate the work of various governments and nongovernmental organizations (NGOs) working in the affected area.
Students are divided into Expert Groups (related to academic specialties such as Economics, Medicine, Political Science, Earth Science, etc.) and spend several days researching their topics. Students are then reassigned to one of seven or eight Country Groups, based on the countries most affected by the disaster. Each country group needs someone representing each expert group. In the scenario, these groups correspond to task forces that must determine what the situation is in each country and try to assess the current need for international assistance.
Students research their country, using internet resources, especially the CIA World Factbook and ReliefWeb, the information coordination website of the United Nations. At a large-group roundtable discussion, each group presents what it has found about its assigned country. As a final product, each student writes an individual report summarizing findings and making recommendations for disaster assistance.
(Note: this resource was added to OER Commons as part of a batch upload of over 2,200 records. If you notice an issue with the quality of the metadata, please let us know by using the 'report' button and we will flag it for consideration.)
Students are employees of a unit of the United Nations responsible for …
Students are employees of a unit of the United Nations responsible for coordinating disaster relief after a major disaster (the 2004 Asian Earthquake and Tsunami) occurs. The agency needs to understand the situation in each country so that it can coordinate the work of various governments and NGO (nongovernmental organizations) working in the affected area.
(Note: this resource was added to OER Commons as part of a batch upload of over 2,200 records. If you notice an issue with the quality of the metadata, please let us know by using the 'report' button and we will flag it for consideration.)
In this multi-part activity, students study seismograms from 3 different seismic stations …
In this multi-part activity, students study seismograms from 3 different seismic stations recording the magnitude 9.0 Sumatra earthquake of December 26th, 2004. By comparing the arrival times of the P and S waves on each seismogram, students determine the distance from the epicenter to each station. Using that data, they can accurately map the location of the epicenter and the precise time of the earthquake. After locating the epicenter, students calculate the position of the tsunami generated by the quake at one hour intervals. From those determinations, predictions are made about how much time people had before the tsunami crashed onto their shores. Finally, students investigate some of the ways people can lessen the impact of the next great tsunami.
(Note: this resource was added to OER Commons as part of a batch upload of over 2,200 records. If you notice an issue with the quality of the metadata, please let us know by using the 'report' button and we will flag it for consideration.)
This activity uses data collected from DART (Deep-ocean Assessment and Reporting of …
This activity uses data collected from DART (Deep-ocean Assessment and Reporting of Tsunamis) stations in the Pacific following the 2011 tsunami generated off the coast of Japan. Students are required to map the wave front after 5, 10, and 15 hours to better understand the speed and propagation of the tsunami wave.
(Note: this resource was added to OER Commons as part of a batch upload of over 2,200 records. If you notice an issue with the quality of the metadata, please let us know by using the 'report' button and we will flag it for consideration.)
This exercise uses the example of the March 28, 2014 M5.1 La …
This exercise uses the example of the March 28, 2014 M5.1 La Habra earthquake to teach about earthquake risk and resilience in southern California. Students will examine seismic waveforms recording during the earthquake, as well as read reports from scientific agencies and news outlets to answer basic questions regarding earthquake risk and resilience.
(Note: this resource was added to OER Commons as part of a batch upload of over 2,200 records. If you notice an issue with the quality of the metadata, please let us know by using the 'report' button and we will flag it for consideration.)
This activity is designed for a primary classroom (outdoors & indoors) investigation …
This activity is designed for a primary classroom (outdoors & indoors) investigation where students collect and investigate soil samples and describe the soils, looking for similarities and differences. Students develop a method of recording the data colleted and can present the information gathered.
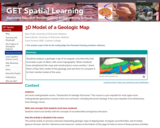
Play-Doh model of a geologic map Provenance: Carol Ormand Ph.D., Carleton College …
Play-Doh model of a geologic map
Provenance: Carol Ormand Ph.D., Carleton College Reuse: This item is offered under a Creative Commons Attribution-NonCommercial-ShareAlike license http://creativecommons.org/licenses/by-nc-sa/3.0/ You may reuse this item for non-commercial purposes as long as you provide attribution and offer any derivative works under a similar license. Students analyze a geologic map of an angular unconformity that truncates a pair of dikes, with some topography. When students have deciphered the map and constructed a cross-section, I show them a Play-Doh model of the geology and ask them to compare it to their mental model of the area.
(Note: this resource was added to OER Commons as part of a batch upload of over 2,200 records. If you notice an issue with the quality of the metadata, please let us know by using the 'report' button and we will flag it for consideration.)
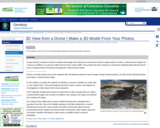
Using cameras mounted to drones, students will design and construct an experiment …
Using cameras mounted to drones, students will design and construct an experiment to take enough photos to make a 3-dimensional image of an outcrop or landform in a process called structure from motion (SfM). This activity has both a hands-on component (collecting data with the drone) and a computer-based component (creating the 3-dimensional model).___________________Drones can take photos that can be analyzed later. By planning ahead to have enough overlap between photos, you take those individual photos and make a 3-dimensional image!In this activity, you guide the students to identify an outcrop or landform to study later or over repeat visits. They go through the process to plan, conduct, and analyze an investigation to help answer their science question.The Challenge: Design and conduct an experiment to take enough photos to make a 3-dimensional image of an outcrop or landform, then analyze the image and interpret the resulting 3-d image.For instance they might wish to study a hillside that has been changed from a previous forest fire. How is the hillside starting to shift after rainstorms or snows? Monitoring an area over many months can lead to discoveries about how the erosional processes happen and also provide homeowners, park rangers, planners, and others valuable information to take action to stabilize areas to prevent landslides.
(Note: this resource was added to OER Commons as part of a batch upload of over 2,200 records. If you notice an issue with the quality of the metadata, please let us know by using the 'report' button and we will flag it for consideration.)
As an activity related to FOSS unit Magnetism and Electricity, 4th grade …
As an activity related to FOSS unit Magnetism and Electricity, 4th grade science students use a computer download to explore electrical circuits and to generate illustrations of electrical circuits for physical models built in class
This classroom activity will show students that there is a lot we …
This classroom activity will show students that there is a lot we don't know about science, for example life throughout the universe. It will hopefully encourage students to question what we know and don't know, and exploration and study of the unknown.
This exercise should be used after you think students know what AFM …
This exercise should be used after you think students know what AFM diagrams are and how they work. This is sort of a quiz -- to see if they can properly interpret the diagrams. There is no point moving on to real projects that involve AFM diagrams if the students don't understand the basics.
(Note: this resource was added to OER Commons as part of a batch upload of over 2,200 records. If you notice an issue with the quality of the metadata, please let us know by using the 'report' button and we will flag it for consideration.)
In this activity, students work with paleoclimate proxy data (d18O, CH4, CO2)from …
In this activity, students work with paleoclimate proxy data (d18O, CH4, CO2)from the Byrd and GISP2 ice cores to investigate millennial-scale climate changes during the Last Glacial/Deglacial time periods. Students must prepare a publication quality plot of the data and answer several questions about the similarities and differences between the time-series (north-south phasing, amplitude, symmetry) and use this information to assess the bipolar see-saw mechanism for abrupt climate changes. Students are encouraged to read two journal articles for more information and to synthesize their results with other information from lectures and earlier readings.
(Note: this resource was added to OER Commons as part of a batch upload of over 2,200 records. If you notice an issue with the quality of the metadata, please let us know by using the 'report' button and we will flag it for consideration.)
Using students' step length to understand the relationship between distance, speed and …
Using students' step length to understand the relationship between distance, speed and acceleration. Includes graphing of data and interpretation of graphs.
Students make a wheel and axle out of cardboard and a wooden …
Students make a wheel and axle out of cardboard and a wooden dowel. It is rooled along a ramp made of parallel meter sticks, and the acceleration can be made small enough to make accurate measurements and calculations.
This is a computer-based activity in which students retrieve data from websites …
This is a computer-based activity in which students retrieve data from websites maintained by the US Geological Survey (USGS) and the National Weather Service (NWS), and then use that data to test different hypotheses regarding streamflow and precipitation. Students import data from web sites into a spreadsheet program where they can construct scatter plots and perform simple statistical tests. The activity has two components, the first focusing on relations between streamflow and drainage basin characteristics (drainage area, slope, precipitation), the second focusing on trends in annual precipitation at two locations in the USA: Burlington, VT, and Boulder, CO. As part of the second component, students conduct a statistical test to determine if the long-term trends in precipitation are significant.
(Note: this resource was added to OER Commons as part of a batch upload of over 2,200 records. If you notice an issue with the quality of the metadata, please let us know by using the 'report' button and we will flag it for consideration.)
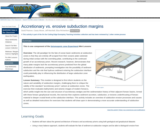
This module examines the nature and variability of subduction margins through examination …
This module examines the nature and variability of subduction margins through examination of data sets that document subduction zone inputs, deformation, and resulting morphology in different settings.
No restrictions on your remixing, redistributing, or making derivative works. Give credit to the author, as required.
Your remixing, redistributing, or making derivatives works comes with some restrictions, including how it is shared.
Your redistributing comes with some restrictions. Do not remix or make derivative works.
Most restrictive license type. Prohibits most uses, sharing, and any changes.
Copyrighted materials, available under Fair Use and the TEACH Act for US-based educators, or other custom arrangements. Go to the resource provider to see their individual restrictions.