Updating search results...

Search Resources

291 Results

View
Selected filters:
  • Measurement and Data
  • College / Upper Division
Isotope Hydrograph Separation
Conditional Remix & Share Permitted
CC BY-NC-SA
Rating
0.0 stars

Separation of hydrographs into event and pre-event fractions based on measurements and data, rather than arbitrary formulae, was a revolutionary technique in watershed hydrology in the 1970s and has continued to be widely used. Hydrograph separation showed that Hortonian overland flow and rapid delivery of "new" event water to streams during storms was not as widely applicable as had been previously thought. Instead, most water in streams during storms in humid, forested watersheds is typically "old", pre-event water. In most cases, hydrograph separations are conducted using the stable isotopes of water, since they are ideal, conservative tracers. In this exercise, we will be conducting a classic isotope hydrograph separation for a forested watershed in northeastern Ohio.

(Note: this resource was added to OER Commons as part of a batch upload of over 2,200 records. If you notice an issue with the quality of the metadata, please let us know by using the 'report' button and we will flag it for consideration.)
Subject:
Biology
Life Science
Mathematics
Measurement and Data
Statistics and Probability
Material Type:
Activity/Lab
Provider:
Science Education Resource Center (SERC) at Carleton College
Provider Set:
Teach the Earth
Author:
Anne Jefferson
Date Added:
11/24/2020
Is the New Madrid Seismic Zone at risk for a large earthquake?
Conditional Remix & Share Permitted
CC BY-NC-SA
Rating
0.0 stars

Students do background reading on the possible origins of intraplate seismicity and also read Nuttli's 1973 paper on the 1811-1812 New Madrid sequence. They construct frequency magnitude diagrams using data they acquire themselves from the openly archived University of Memphis catalog, Southern California Earthquake Center catalog, and USGS global catalog. They use these diagrams to estimate a recurrence interval for large magnitude earthquakes at the NMSZ. They then split into teams to read papers detailing campaign GPS surveys, paleoseismic measurements, and heat flow measurements. Each team is responsible for summarizing their set of papers for the other students. The culminating assignment is to update Gomberg and Schweig's 2002 USGS pamphlet "Earthquake hazard in the heart of the homeland" using scientific results that postdate the original pamphlet (including their own analysis). We also end with a "teaching and learning discussion" in which the students, who are usually high school teachers themselves, trade ideas about how they could repurpose parts of the lesson for use in their own classrooms. This activity gives students practice in data analysis and reading scientific papers, it shows them a few resources where they can find openly available data, and it gives them a chance to participate in the practice of science.
Teaching Tips
Adaptations that allow this activity to be successful in an online environment
This lesson was constructed specifically for an online course and didn't exist beforehand. I think it could work in a face-to-face course, too.
Elements of this activity that are most effective
Students,especially ones who are not as literate with software plotting / analysis programs, find the problem set somewhat difficult because the datasets are large and I am asking them to collect the data themselves, then use it to make a second-order plot and analyze that, instead of just plotting "A" vs. "B" and analyzing it.

That being said, I know that students are excited to be able to produce a plot themselves that exactly mimics one they can find in a published paper, and furthermore they are happy to find resources such as the USGS earthquake catalog that contain available real-time data.

The part where they have to compare and contrast the strengths and weaknesses of each technique used to study the NMSZ (seismology, paleoseismology, GPS, etc) is important because they get a real sense of how different approaches are important to resolve a scientific debate. I know they are learning something when they get frustrated because there isn't an easy answer!
Recommendations for other faculty adapting this activity to their own course:
-Be prepared to help students get through the technical aspects of some of the scientific papers, especially if they are not used to reading scientific papers. When I pick the papers for them to read, I purposely pick ones that aren't too long (Science, Nature, GRL, etc) and I try to pick ones that came with a press release, "news and views" or similar, and then I tell the students to read the press release first and then the paper.

-Be prepared to give students hints about counting and sorting data to make the frequency-magnitude diagrams because you'd rather lead them towards how to make the plots and then let them get on with the analysis as opposed to letting them get so frustrated with their lack of technical skills that they aren't interested in the science anymore. This exercise should be about seismology; it shouldn't be an excel tutorial! I have a little set of screen capture movie how-to hints under a hidden url, and when I can tell that a student is really suffering I reveal them.

(Note: this resource was added to OER Commons as part of a batch upload of over 2,200 records. If you notice an issue with the quality of the metadata, please let us know by using the 'report' button and we will flag it for consideration.)

Subject:
Biology
Life Science
Mathematics
Measurement and Data
Statistics and Probability
Material Type:
Activity/Lab
Provider:
Science Education Resource Center (SERC) at Carleton College
Provider Set:
Teach the Earth
Author:
Eliza Richardson
Date Added:
12/11/2020
Julia Data Science
Conditional Remix & Share Permitted
CC BY-NC-SA
Rating
0.0 stars

This is an open-source and open access book on how to do Data Science using Julia. The book describes the basics of the Julia programming language DataFrames.jl for data manipulation and Makie.jl for data visualization.

You will learn to:

- Read CSV and Excel data into Julia
- Process data in Julia, that is, learn how to answer data questions
- Filter and subset data
- Handle missing data
- Join multiple data sources together
- Group and summarize data
- Export data out of Julia to CSV and Excel files
- Plot data with different Makie.jl backends
- Save visualizations in several formats such as PNG or PDF
- Use different plotting functions to make diverse data visualizations
- Customize visualizations with attributes
- Use and create new plotting themes
- Add LaTeX elements to plots
- Manipulate color and palettes
- Create complex figure layouts

Subject:
Applied Science
Computer Science
Information Science
Mathematics
Measurement and Data
Material Type:
Textbook
Author:
Jose Storopoli
Lazaro Alonso
Rik Huijzer
Date Added:
11/10/2021
Kohler Curves
Conditional Remix & Share Permitted
CC BY-NC-SA
Rating
0.0 stars

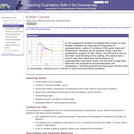
An assignment teaching students about Kohler curves that enhances their quantitative skills.

(Note: this resource was added to OER Commons as part of a batch upload of over 2,200 records. If you notice an issue with the quality of the metadata, please let us know by using the 'report' button and we will flag it for consideration.)
Subject:
Biology
Geoscience
Life Science
Mathematics
Measurement and Data
Physical Science
Statistics and Probability
Material Type:
Activity/Lab
Provider:
Science Education Resource Center (SERC) at Carleton College
Provider Set:
Teach the Earth
Author:
Swarndeep Gill
Date Added:
08/23/2020
LONGPRO Stream Modeling Exercise
Conditional Remix & Share Permitted
CC BY-NC-SA
Rating
0.0 stars

The purpose of this exercise is to integrate modeling with field data. The activity includes links to a "virtual field trip" of maps and photographs. Data from a creek is included in the field trip and students use an Excel spreadsheet model to analyze the data.

(Note: this resource was added to OER Commons as part of a batch upload of over 2,200 records. If you notice an issue with the quality of the metadata, please let us know by using the 'report' button and we will flag it for consideration.)

Subject:
Biology
Geoscience
Life Science
Mathematics
Measurement and Data
Physical Science
Statistics and Probability
Material Type:
Activity/Lab
Interactive
Simulation
Provider:
Science Education Resource Center (SERC) at Carleton College
Provider Set:
Teach the Earth
Author:
William Locke
Date Added:
11/24/2020
Laboratory Analogs of Faults
Conditional Remix & Share Permitted
CC BY-NC-SA
Rating
0.0 stars

This activity utilizes a sandbox analog model which is used to create normal faults and a foreland propagating fold and thrust belt. For the normal fault portion of the activity, students investigate the progression of normal fault generation and accumulation of offset. During the thrust fault portion of the activity, students evaluate (1) the initiation angles of thrust faults, (2) compare that to the final angles to understand how fault angles rotate with progressive thrust propagation, and (3) they visualize how the critical slope angle is involved in the initiation of younger thrust faults. In addition, they conceptualize methods utilized to evaluate the magnitude of fault offset, and vertical and horizontal shortening.
This activity is motivated by and utilizes a sandbox model from:
Dell Castello, M., and Cooke, M., 2008, Watch faults grow before your very eyes in a deformational sandbox: Journal of Geoscience Education, v. 56, p. 324-333.
Tips for the activity: I place a sheet of sandpaper under the sand on one side of the compression experiment to test the outcomes with varying basal friction. For the extension portion, I attach separate metal sheets to the stationary wall and the moving wall, under the sand. These sheets are joined by elastic fabric. To save money, mix non-toxic paint powder into basic sand to get colored sand.

(Note: this resource was added to OER Commons as part of a batch upload of over 2,200 records. If you notice an issue with the quality of the metadata, please let us know by using the 'report' button and we will flag it for consideration.)

Subject:
Biology
Life Science
Mathematics
Measurement and Data
Statistics and Probability
Material Type:
Activity/Lab
Provider:
Science Education Resource Center (SERC) at Carleton College
Provider Set:
Teach the Earth
Author:
Jackie Langille
Date Added:
11/25/2019
Laboratory Exercise: What Controls Rheology?
Conditional Remix & Share Permitted
CC BY-NC-SA
Rating
0.0 stars

A short laboratory exercise, conducted by students, is used to illustrate the multiple factors that contribute to rocks' varied responses to deformation. Analogue materials (play-doh, notebook springs, butter, silly putty, plastic bags, etc.) are used to illustrate many of the controlling factors such as lithology, stress, temperature, confining pressure, strain rate, preexisting weaknesses, and accumulated strain. The analogue experiments are presented in conjunction with parallel data from deformation experiments and field studies. The tandem presentation of analogue experiment and real data requires the students to obtain a natural "feel" for rheologic parameters and more exhaustively analyze the important conclusions obtained from field and deformation experiment data.

(Note: this resource was added to OER Commons as part of a batch upload of over 2,200 records. If you notice an issue with the quality of the metadata, please let us know by using the 'report' button and we will flag it for consideration.)

Subject:
Biology
Life Science
Mathematics
Measurement and Data
Statistics and Probability
Material Type:
Activity/Lab
Provider:
Science Education Resource Center (SERC) at Carleton College
Provider Set:
Teach the Earth
Author:
Dyanna Czeck
Date Added:
08/18/2019
Lake Level Changes in the Arid West
Conditional Remix & Share Permitted
CC BY-NC-SA
Rating
0.0 stars

Students use the modeling program STELLA to see what combinations of runoff and evaporation might have lead to Pleistocene lake level oscillations in California's Owens River system.

(Note: this resource was added to OER Commons as part of a batch upload of over 2,200 records. If you notice an issue with the quality of the metadata, please let us know by using the 'report' button and we will flag it for consideration.)
Subject:
Biology
Geoscience
Life Science
Mathematics
Measurement and Data
Physical Science
Statistics and Probability
Material Type:
Activity/Lab
Interactive
Provider:
Science Education Resource Center (SERC) at Carleton College
Provider Set:
Teach the Earth
Author:
Kirsten Menking
Date Added:
09/03/2020
Lake Mixing Module
Conditional Remix & Share Permitted
CC BY-NC-SA
Rating
0.0 stars

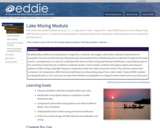
Stratified lakes exhibit vertical gradients in organisms, nutrients, and oxygen, which have important implications for ecosystem structure and functioning. Mixing disrupts these gradients by redistributing these materials throughout the water column. Consequently, it is critical to understand the drivers of lake mixing and thermal stratification, especially because of the sensitivity of lake thermal conditions to altered climate. In this module, students will explore spatial and temporal patterns of lake mixing using high-frequency temperature data from lakes around the world. They will also explore how increases in air temperature affect thermal stratification by interpreting output from a lake model. Project EDDIE modules are designed with an A-B-C structure to make them flexible and adaptable to a range of student levels and course structures.

(Note: this resource was added to OER Commons as part of a batch upload of over 2,200 records. If you notice an issue with the quality of the metadata, please let us know by using the 'report' button and we will flag it for consideration.)
Subject:
Applied Science
Biology
Chemistry
Environmental Science
Hydrology
Life Science
Mathematics
Measurement and Data
Physical Science
Statistics and Probability
Material Type:
Activity/Lab
Provider:
Science Education Resource Center (SERC) at Carleton College
Provider Set:
Teach the Earth
Author:
This module was initially developed by Carey, C.C., J.L. Klug, and R.L. Fuller. 1 August 2015. Project EDDIE: Dynamics of Lake Mixing. Project EDDIE Module 3, Version 1. cemast.illinoisstate.edu/data-for-students/modules/lake-mixing.shtml. Module development was supported by NSF DEB 1245707.
Date Added:
09/19/2022
Landscape Diffusion Lab
Conditional Remix & Share Permitted
CC BY-NC-SA
Rating
0.0 stars

Students create a STELLA model of two marine terrace platforms separated in elevation by a cliff, using the hillslope flux equation to simulate the change in the cliff face over time as diffusive processes tear it down.

(Note: this resource was added to OER Commons as part of a batch upload of over 2,200 records. If you notice an issue with the quality of the metadata, please let us know by using the 'report' button and we will flag it for consideration.)
Subject:
Biology
Geoscience
Life Science
Mathematics
Measurement and Data
Oceanography
Physical Science
Statistics and Probability
Material Type:
Activity/Lab
Interactive
Provider:
Science Education Resource Center (SERC) at Carleton College
Provider Set:
Teach the Earth
Author:
Kirsten Menking
Date Added:
09/03/2019
Landscape Interpretation and Visualization Using A GIS
Conditional Remix & Share Permitted
CC BY-NC-SA
Rating
0.0 stars

Students utilize digital data of areas they previously explored using traditional topographic map techniques. This assignment allows students to evaluate prior assumptions about spatial relationships while learning basic GIS tools.

Subject:
Education
Educational Technology
Mathematics
Measurement and Data
Material Type:
Activity/Lab
Homework/Assignment
Provider:
Science Education Resource Center (SERC) at Carleton College
Provider Set:
Teach the Earth
Author:
John Van Hoesen
Date Added:
01/20/2023
Landslides - Infinite Slope Factor-of-Safety Model
Conditional Remix & Share Permitted
CC BY-NC-SA
Rating
0.0 stars

Unit composed of 3 exercises designed to expose students to the physical processes that lead to landslides and how scientists model these processes.

(Note: this resource was added to OER Commons as part of a batch upload of over 2,200 records. If you notice an issue with the quality of the metadata, please let us know by using the 'report' button and we will flag it for consideration.)

Subject:
Biology
Life Science
Mathematics
Measurement and Data
Statistics and Probability
Material Type:
Activity/Lab
Provider:
Science Education Resource Center (SERC) at Carleton College
Provider Set:
Teach the Earth
Author:
Ronda Strauch
Date Added:
05/22/2019
Learning pseudosections with Perplex
Conditional Remix & Share Permitted
CC BY-NC-SA
Rating
0.0 stars

This is a set of five exercises that teach the basic skills of using Perplex and the possible types of understanding one can gain from the use of internally-consistent thermodynamic databases. The exercises culminate in the creation of a pseudosection for a particular rock.

(Note: this resource was added to OER Commons as part of a batch upload of over 2,200 records. If you notice an issue with the quality of the metadata, please let us know by using the 'report' button and we will flag it for consideration.)
Subject:
Biology
Life Science
Mathematics
Measurement and Data
Physical Science
Physics
Statistics and Probability
Material Type:
Activity/Lab
Provider:
Science Education Resource Center (SERC) at Carleton College
Provider Set:
Teach the Earth
Author:
Dave Hirsch
Date Added:
08/23/2020
Let's Take a Hike in Catoctin Mountain Park
Conditional Remix & Share Permitted
CC BY-NC-SA
Rating
0.0 stars

Spreadsheets Across the Curriculum module/Geology of National Parks course. Students use a topographic map and spreadsheet to find how many Big Macs they burned off on a five-mile hike at Catoctin Mountain Park.

(Note: this resource was added to OER Commons as part of a batch upload of over 2,200 records. If you notice an issue with the quality of the metadata, please let us know by using the 'report' button and we will flag it for consideration.)

Subject:
Biology
Life Science
Mathematics
Measurement and Data
Statistics and Probability
Material Type:
Activity/Lab
Provider:
Science Education Resource Center (SERC) at Carleton College
Provider Set:
Teach the Earth
Author:
Module by: Meghan Lindsey, University of South Florida Cover Page by: Meghan Lindsey, Len Vacher and Denise Davis, University of South Florida
Date Added:
12/16/2020
Local Power Portfolio
Conditional Remix & Share Permitted
CC BY-NC-SA
Rating
0.0 stars

The goal of this exercise is to illustrate how each municipality needs to have a energy portfolio that is specific to their needs.

The students analyze a spreadsheet that links % of energy types to 6 output categories; cost, environmental impact, NIMBY, and three types of industrial emissions. As the students input % values for each energy type the overall value of each output category is calculated.

The challenge is for the students to come up with energy plans for multiple cities. Each of these cities would have different limits on either the maximum % of an energy type or one of the specific categories.

Example: Detroit, Michigan would use a low cap on the cost category so their energy plan would need to be very affordable. Seattle, Washington would only allow for 2-3% solar because climactic conditions don't favor solar energy.

For the last portion of the activity the students would come up with a plan for their own town and then be able to look up the current plan at https://www.epa.gov/egrid/power-profiler#/. They could then discuss how their plan and the currently implemented plan compare.

Subject:
Mathematics
Measurement and Data
Statistics and Probability
Material Type:
Activity/Lab
Provider:
Science Education Resource Center (SERC) at Carleton College
Provider Set:
Teach the Earth
Author:
Ander Sundell
Date Added:
01/20/2023
Macroevolution @ ISU - BIOL 465X/EEOB 565X
Unrestricted Use
CC BY
Rating
0.0 stars

Open courseware for Macroevolution, focusing on research methods and software packages, such as R.

Course description
Evolutionary thinking provides the underpinnings of modern biology. In recent decades, the field of macroevolution (evolution above the species level) has matured into a rich discipline with a well-developed mathematical theory for testing hypotheses of species diversification, for understanding trait evolution, and evaluating patterns of covariation across the tree of life. This course will provide a synthetic view of biology and how life on earth has changed over time.

Course Outcomes
Upon completion of the course, students will:
Understand patterns of diversity in the fossil record, and changes in that diversity over time
Understand macroevolutionary patterns and processes, and the difference between gradualism, stasis, and punctuated equilibrium
Become familiar with ‘tree thinking’, and understand the principles of using a phylogenetic perspective to address evolutionary questions in biology
Gain experience in applying cutting-edge phylogenetic methods for testing hypotheses in macroevolution

Subject:
Applied Science
Biology
Ecology
Environmental Science
Life Science
Mathematics
Measurement and Data
Physical Science
Material Type:
Activity/Lab
Full Course
Lecture Notes
Module
Syllabus
Provider:
Iowa State University
Author:
Josh Justison
Tracy Heath
Date Added:
07/05/2022
Magma Modification in the central Sierra Nevada Batholith
Conditional Remix & Share Permitted
CC BY-NC-SA
Rating
0.0 stars

This exercise is centered around a suite of rocks from the Sierra Nevada batholith. The activities are designed to give petrology students a capstone experience for the igneous portion of the upper-level Petrology course. Students are given thin sections with hand samples, a map and a table of geochemical analyses (in Excel format) and asked to record hand-sample and thin section observations with the idea that these will be used to understand processes that were active during batholith generation. By the time they encounter this lab, the students have spent at least 7 lab periods looking at a variety of igneous rocks and their textures. Because students are given geochemical analyses, they are also expected to experiment with the use of graphs (e.g., Harker and spider diagrams) to better understand tables of geochemical analyses. The students use observations about rocks and geochemistry to build a coherent story around these rocks; the final product is a short paper in which they use petrographic observations and geochemical diagrams to back up their interpretations.

(Note: this resource was added to OER Commons as part of a batch upload of over 2,200 records. If you notice an issue with the quality of the metadata, please let us know by using the 'report' button and we will flag it for consideration.)
Subject:
Biology
Chemistry
Life Science
Mathematics
Measurement and Data
Physical Science
Statistics and Probability
Material Type:
Activity/Lab
Data Set
Homework/Assignment
Lesson Plan
Provider:
Science Education Resource Center (SERC) at Carleton College
Provider Set:
Teach the Earth
Author:
Jennifer Wenner
Date Added:
08/21/2019
Mapping Magnetic Intensity Data Using a Trend Surface Analysis
Conditional Remix & Share Permitted
CC BY-NC-SA
Rating
0.0 stars

Provides students with an opportunity to work with and interpret magnetic intensity data (nT). Challenges them to explain magnetic intensity to an introductory geology student.

Subject:
Education
Educational Technology
Mathematics
Measurement and Data
Material Type:
Activity/Lab
Homework/Assignment
Provider:
Science Education Resource Center (SERC) at Carleton College
Provider Set:
Teach the Earth
Author:
Ann Deakin
Date Added:
01/20/2023
Math Review
Conditional Remix & Share Permitted
CC BY-NC-SA
Rating
0.0 stars

This is designed as an introductory lab for hydrogeology or other upper-level courses that are quantitative in nature in order to review key mathematical concepts that will be used throughout the semester.

Subject:
Mathematics
Measurement and Data
Statistics and Probability
Material Type:
Activity/Lab
Provider:
Science Education Resource Center (SERC) at Carleton College
Provider Set:
Teach the Earth
Author:
Kallina Dunkle
Date Added:
01/20/2023
Matlab Module to Delineate Zones of Contribution
Conditional Remix & Share Permitted
CC BY-NC-SA
Rating
0.0 stars

This is a visual demonstration of the effects of aquifer parameters and stresses on the size and shape of zones of contribution. With these simple Matlab routines, students can rapidly observe zones of contributions for different sets of input parameters.

(Note: this resource was added to OER Commons as part of a batch upload of over 2,200 records. If you notice an issue with the quality of the metadata, please let us know by using the 'report' button and we will flag it for consideration.)
Subject:
Biology
Life Science
Mathematics
Measurement and Data
Statistics and Probability
Material Type:
Activity/Lab
Provider:
Science Education Resource Center (SERC) at Carleton College
Provider Set:
Teach the Earth
Author:
Roseanna Neupauer
Date Added:
08/28/2019