Introduction to the linguistic study of language pathology, concentrating on experimental approaches …
Introduction to the linguistic study of language pathology, concentrating on experimental approaches and theoretical explanations. Discussion of Specific Language Impairment, autism, Down syndrome, Williams syndrome, normal aging, Parkinson’s disease, Alzheimer’s disease, hemispherectomy and aphasia. Focuses on the comparison of linguistic abilities among these syndromes, while drawing clear comparisons with first and second language acquisition. Topics include the lexicon, morphology, syntax, semantics and pragmatics. Relates the lost linguistic abilities in these syndromes to properties of the brain.
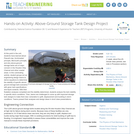
At this point in the unit, students have learned about Pascal's law, …
At this point in the unit, students have learned about Pascal's law, Archimedes' principle, Bernoulli's principle, and why above-ground storage tanks are of major concern in the Houston Ship Channel and other coastal areas. In this culminating activity, student groups act as engineering design teams to derive equations to determine the stability of specific above-ground storage tank scenarios with given tank specifications and liquid contents. With their floatation analyses completed and the stability determined, students analyze the tank stability in specific storm conditions. Then, teams are challenged to come up with improved storage tank designs to make them less vulnerable to uplift, displacement and buckling in storm conditions. Teams present their analyses and design ideas in short class presentations.
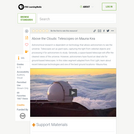
This video segment adapted from First Light explains why the highest peak …
This video segment adapted from First Light explains why the highest peak in the Pacific, Mauna Kea, is an ideal site for astronomical observations. Featured are new telescope technologies that allow astronomers to explore the universe in more depth.
In this 6-part activity, students learn about climate change during the Cenozoic …
In this 6-part activity, students learn about climate change during the Cenozoic and the abrupt changes at the Cretaceous/Paleogene boundary (65.5 million years ago), the Eocene/Oligocene boundary (33.9 million years ago), and the Paleocene/Eocene boundary (55.8 million years ago).
This group activity engages students in the calculation of absorption spectra. It …
This group activity engages students in the calculation of absorption spectra. It is appropriate for any course covering the baseline mathematical concepts of atomic spectra, including chemistry, physics, astronomy, and related courses.
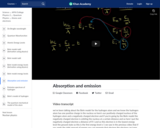
Using shell model diagram to relate absorption to emission. Derives relationship between …
Using shell model diagram to relate absorption to emission. Derives relationship between emitted photon and energy levels, the Balmer-Rydberg equation. Created by Jay.
This is an exciting time for the energy industry—energy revolutions are underway …
This is an exciting time for the energy industry—energy revolutions are underway and things are changing quickly. Fossil fuels (coal, oil, and natural gas) and biomass have dominated the energy landscape for centuries and are the leading contributors to global climate change, hazardous environmental impacts, and human health issues. However, global energy production is now shifting to clean sources, like energy efficiency and renewables, that release little to no greenhouse gases and have fewer environmental impacts. This shift is critical to reaching net zero* goals and limiting the increase in global average temperatures, as well as improving air quality and reducing the human health effects of energy.
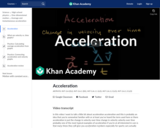
Acceleration (a) is the change in velocity (Δv) over the change in …
Acceleration (a) is the change in velocity (Δv) over the change in time (Δt), represented by the equation a = Δv/Δt. This allows you to measure how fast velocity changes in meters per second squared (m/s^2). Acceleration is also a vector quantity, so it includes both magnitude and direction. Created by Sal Khan.
Using students' step length to understand the relationship between distance, speed and …
Using students' step length to understand the relationship between distance, speed and acceleration. Includes graphing of data and interpretation of graphs.
Students make a wheel and axle out of cardboard and a wooden …
Students make a wheel and axle out of cardboard and a wooden dowel. It is rooled along a ramp made of parallel meter sticks, and the acceleration can be made small enough to make accurate measurements and calculations.
Students work as physicists to understand centripetal acceleration concepts. They also learn …
Students work as physicists to understand centripetal acceleration concepts. They also learn about a good robot design and the accelerometer sensor. They also learn about the relationship between centripetal acceleration and centripetal force governed by the radius between the motor and accelerometer and the amount of mass at the end of the robot's arm. Students graph and analyze data collected from an accelerometer, and learn to design robots with proper weight distribution across the robot for their robotic arms. Upon using a data logging program, they view their own data collected during the activity. By activity end , students understand how a change in radius or mass can affect the data obtained from the accelerometer through the plots generated from the data logging program. More specifically, students learn about the accuracy and precision of the accelerometer measurements from numerous trials.
This is a treasure hunt game that simulates various disabilities and gives …
This is a treasure hunt game that simulates various disabilities and gives a sense of how frustrating non-accessible content can be for people with disabilities. Suitable for a general audience, no programming experience necessary. An editable copy is also given, along with ideas about how to make it more accessible.
This is a computer-based activity in which students retrieve data from websites …
This is a computer-based activity in which students retrieve data from websites maintained by the US Geological Survey (USGS) and the National Weather Service (NWS), and then use that data to test different hypotheses regarding streamflow and precipitation. Students import data from web sites into a spreadsheet program where they can construct scatter plots and perform simple statistical tests. The activity has two components, the first focusing on relations between streamflow and drainage basin characteristics (drainage area, slope, precipitation), the second focusing on trends in annual precipitation at two locations in the USA: Burlington, VT, and Boulder, CO. As part of the second component, students conduct a statistical test to determine if the long-term trends in precipitation are significant.
(Note: this resource was added to OER Commons as part of a batch upload of over 2,200 records. If you notice an issue with the quality of the metadata, please let us know by using the 'report' button and we will flag it for consideration.)
This segment from Swift: Eyes through Time traces the history military officers …
This segment from Swift: Eyes through Time traces the history military officers and engineers discovering a strange phenomenon in the sky that astronomers now know are gamma-ray bursts.
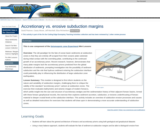
This module examines the nature and variability of subduction margins through examination …
This module examines the nature and variability of subduction margins through examination of data sets that document subduction zone inputs, deformation, and resulting morphology in different settings.
In this lab exercise, students practice correctly using measurement tools, recording data, …
In this lab exercise, students practice correctly using measurement tools, recording data, calculating density, using significant figures, and exploring the concepts of accuracy and precision.
No restrictions on your remixing, redistributing, or making derivative works. Give credit to the author, as required.
Your remixing, redistributing, or making derivatives works comes with some restrictions, including how it is shared.
Your redistributing comes with some restrictions. Do not remix or make derivative works.
Most restrictive license type. Prohibits most uses, sharing, and any changes.
Copyrighted materials, available under Fair Use and the TEACH Act for US-based educators, or other custom arrangements. Go to the resource provider to see their individual restrictions.