This investigation is a laboratory activity in which the alkalinity of 2 …
This investigation is a laboratory activity in which the alkalinity of 2 types of substrates (carbonate vs. non-carbonate) are compared on the basis of titration. Students will reflect on the relationship of alkalinity and toxic heavy metals. Teaching ideas from: Project Wet, Water Education for Teachers as found in: "Healthy Water Healthy People, Field Monitoring Guide "(2003)
In this activity, students compare two photographs (with time spans of 30-100 …
In this activity, students compare two photographs (with time spans of 30-100 years between photos) of specific Alaskan glaciers to observe how glaciers have changed over the time interval. Activity is a good kickoff for learning about glaciology - how and why glaciers form, grow and shrink, and their relation to climate change.
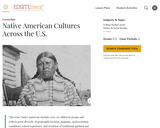
This lesson discusses the differences between common representations of Native Americans within …
This lesson discusses the differences between common representations of Native Americans within the U.S. and a more differentiated view of historical and contemporary cultures of five American Indian tribes living in different geographical areas. Students will learn about customs and traditions such as housing, agriculture, and ceremonial dress for the Tlingit, Dinè, Lakota, Muscogee, and Iroquois peoples.
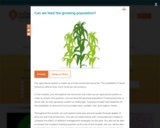
Our agricultural system is made up of interconnected resources. The availability of …
Our agricultural system is made up of interconnected resources. The availability of these resources affects how much food we can produce. In this module, you will explore the resources that make up our agricultural system in order to answer the question: can we feed the growing population? Food production is faced with an ever-growing number of challenges. Growing enough food depends on the availability of resources such as arable land, sunlight, rain, and organic matter. Throughout this activity, you will explore land uses and soil quality through graphs of land use and crop production. You will run experiments with computational models to compare the effect of different management strategies on the land. You will not be able to answer the module's framing question at the end of the module, but you will be able to describe how humans can maintain and replenish important resources to be able to produce food long into the future.
Short Description: History and Science of Cultivated Plants narrates how humans transitioned …
Short Description: History and Science of Cultivated Plants narrates how humans transitioned from foragers to farmers and have arrived at present-day industrial agriculture-based civilization. It entails myths, historical accounts, and scientific concepts to describe how human efforts have shaped and produced easier to grow, larger, tastier, and more nutritious fruits, vegetables, and grains from wild plants. Using examples of various economically and socially important crops central to human civilization, the book describes the origin of crop plants, the evolution of agricultural practices, fundamental concepts of natural selection vs. domestication, experimental and methodical plant breeding, and plant biotechnology. Data dashboard
Word Count: 48729
(Note: This resource's metadata has been created automatically by reformatting and/or combining the information that the author initially provided as part of a bulk import process.)
Why Keep SAE Records? Grade Level: 8th - 9thSubject: Introduction to Agricultural, Food, and Natural ResourcesDuration: 100 MinutesDOK Level: 4SAMR Level: Modification and RedefinitionIndiana Standard: IAFNR-3.3 Develop an individual SAE program and implement record keeping skillsObjective: Students will be able to design and evaluate different record keeping systems for SAEs.Essential Question: Why keep SAE records?Procedure: Show the video SAE part 3Go through the presentation Why keep SAE recordsExplain and demonstrate the parts of the Attica FFA Record BookHave the students take out their research notebooksProvide the students with their own copy of the record book through google classroomEnter the first lab into their record books under the agriscience tabHave the students complete the next two labs on their ownThe students will adjust the tabs to fit their main SAE project.The students will enter two weeks worth of recordsProduct or Assessment: The assessment will be given on the students two week worth of records. After the initial grading of the record books, they will be graded monthly to ensure the record books are being kept up to date.
This video from Kentucky's Last Great Places shows how the Green River …
This video from Kentucky's Last Great Places shows how the Green River has remained unusually clean and why it is home to several endangered aquatic species.
The purpose of this resource is to observe plant green-up and report …
The purpose of this resource is to observe plant green-up and report data that will be used by scientists to validate satellite estimates of the beginning of the plant growing season. Students monitor budburst and growth of leaves of selected trees, shrubs, or grasses. Species chosen should be native, deciduous, and dominant in your area.
In this activity, students will learn how water can be polluted by …
In this activity, students will learn how water can be polluted by algal blooms. They will grow algae with different concentrations of fertilizer or nutrients and analyze their results as environmental engineers working to protect a local water resource.
Learners research the effects of melting sea ice in the Bering Sea …
Learners research the effects of melting sea ice in the Bering Sea Ecosystem. They create research proposals to earn a place on the scientific research vessel Healy and present their findings and proposals to a Research Board committee.
tells the stories of three cities established after the Comstock Lode discovery …
tells the stories of three cities established after the Comstock Lode discovery in 1859 brought a reverse migration from California. The stories, told by this travel itinerary of 57 places, feature the mining and agricultural city now known for gaming, the remarkable collection of 19th-century buildings created with wealth generated by the Comstock Lode, and the state capital.
This video features Dr. Gary Griggs, a scientist with the National Research …
This video features Dr. Gary Griggs, a scientist with the National Research Council, discussing predictions for sea-level rise on the West Coast states. The video includes effective visualizations and animations of the effects of plate tectonics and sea level rise on the West Coast.
The Nebraska Departments of Labor, Economic Development and Education collaborated to provide …
The Nebraska Departments of Labor, Economic Development and Education collaborated to provide educators, economic developers, students and their parents, community leaders and career seekers information on the states’ high skill, high wage and high demand occupations that can be sorted by region or statewide or grouped by Career or Industry Cluster.
In this video segment adapted from LOKE Films and the Arctic Monitoring …
In this video segment adapted from LOKE Films and the Arctic Monitoring and Assessment Programme, learn how human populations in the Arctic are affected by industrial contaminants in the food chain.
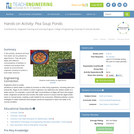
Working as if they are engineers aiming to analyze and then improve …
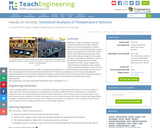
Working as if they are engineers aiming to analyze and then improve data collection devices for precision agriculture, students determine how accurate temperature sensors are by comparing them to each other. Teams record soil temperature data during a class period while making changes to the samples to mimic real-world crop conditions—such as the addition of water and heat and the removal of the heat. Groups analyze their collected data by finding the mean, median, mode, and standard deviation. Then, the class combines all the team data points in order to compare data collected from numerous devices and analyze the accuracy of their recording devices by finding the standard deviation of temperature readings at each minute. By averaging the standard deviations of each minute’s temperature reading, students determine the accuracy of their temperature sensors. Students present their findings and conclusions, including making recommendations for temperature sensor improvements.
No restrictions on your remixing, redistributing, or making derivative works. Give credit to the author, as required.
Your remixing, redistributing, or making derivatives works comes with some restrictions, including how it is shared.
Your redistributing comes with some restrictions. Do not remix or make derivative works.
Most restrictive license type. Prohibits most uses, sharing, and any changes.
Copyrighted materials, available under Fair Use and the TEACH Act for US-based educators, or other custom arrangements. Go to the resource provider to see their individual restrictions.