There are 1 billion (1,000,000,000) nanometers in a meter. In this classroom …
There are 1 billion (1,000,000,000) nanometers in a meter. In this classroom activity students will gain an understanding of what that statement means.
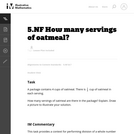
Spreadsheets Across the Curriculum module. Students build a spreadshet to calculate grams …
Spreadsheets Across the Curriculum module. Students build a spreadshet to calculate grams solute to add to liters solvent to produce solution of desired concentration (mol/L).
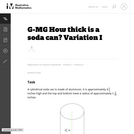
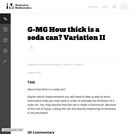
his is a version of ''How thick is a soda can I'' …
his is a version of ''How thick is a soda can I'' which allows students to work independently and think about how they can determine how thick a soda can is. The teacher should explain clearly that the goal of this task is to come up with an ''indirect'' means of assessing how thick the can is, that is directly measuring its thickness is not allowed.
In this problem-based learning (PBL) activity, students take on the role of …
In this problem-based learning (PBL) activity, students take on the role of a student research scientist and explore the role of solar energy in determining climate. Students conduct experiments to observe how a change in water phase affects surface temperatures. Materials required for the investigation include 2 aquariums, dry sand or soil, two heat lamps, and two thermometers.The lesson is supported by teacher notes, answer key, glossary and an appendix with information about using PBL in the classroom. This is the second of three activities in Investigating the Climate System: Energy, a Balancing Act.
SSAC Physical Volcanology module. Students build a spreadsheet to calculate velocity of …
SSAC Physical Volcanology module. Students build a spreadsheet to calculate velocity of rising magma in steady-state Plinian eruptions using conservation of mass and momentum.
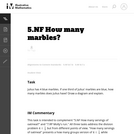
The purpose of this task is to continue a crucial strand of …
The purpose of this task is to continue a crucial strand of algebraic reasoning begun at the middle school level (e.g, 6.EE.5). By asking students to reason about solutions without explicily solving them, we get at the heart of understanding what an equation is and what it means for a number to be a solution to an equation. The equations are intentionally very simple; the point of the task is not to test technique in solving equations, but to encourage students to reason about them.
This task can be used as a quick assessment to see if …
This task can be used as a quick assessment to see if students can make sense of a graph in the context of a real world situation. Students also have to pay attention to the scale on the vertical axis to find the correct match.
These problems are meant to be a progression which require more sophisticated …
These problems are meant to be a progression which require more sophisticated understandings of the meaning of fractions as students progress through them.
In this activity, students will investigate the questions: What are the benefits/costs …
In this activity, students will investigate the questions: What are the benefits/costs of 3 varieties of shower head types: standard, low flow, massage spray? Which would be best for a homeowner? For the university dorms?
(Note: this resource was added to OER Commons as part of a batch upload of over 2,200 records. If you notice an issue with the quality of the metadata, please let us know by using the 'report' button and we will flag it for consideration.)
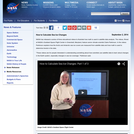
This set of three videos illustrates how math is used in satellite …
This set of three videos illustrates how math is used in satellite data analysis. The videos feature NASA senior climate scientist Claire Parkinson. Parkinson explains how the Arctic and Antarctic sea ice covers are measured from satellite data and how math is used to determine trends in the data. In the first video, she leads viewers from satellite data collection through obtaining a time series of monthly average sea ice extents for November 1978 – December 2012, for the Arctic and Antarctic. In the second video, she begins with the time series from the first video, removes the seasonal cycle by calculating yearly averages, and proceeds to calculate the slopes of the lines to get trends in the data, revealing decreasing sea ice coverage in the Arctic and increasing sea ice coverage in the Antarctic. In the third video, she uses a more advanced technique to remove the seasonal cycle and shows that the trends are close to the same, whichever method is used. She emphasizes the power of math and that the techniques shown for satellite sea ice data can also be applied to a wide range of data sets.
This lesson is about the estimation of the value of Pi. Based …
This lesson is about the estimation of the value of Pi. Based on previous knowledge, the students try to estimate Pi value using different methods, such as: direct physical measurements; a geometric probability model; and computer technology. This lesson is designed to stimulate the learning interests of students, to enrich their experience of solving practical problems, and to develop their critical thinking ability. To understand this lesson, students should have some mathematic knowledge about circles, coordinate systems, and geometric probability. They may also need to know something about Excel. To estimate Pi value by direct physical measurements, the students can use any round or cylindrical shaped objects around them, such as round cups or water bottles. When estimating Pi value by a geometric probability model, a dartboard and darts should be prepared before the class. You can also use other games to substitute the dart throwing game. For example, you can throw marbles to the target drawn on the floor. This lesson is about 45-50 minutes. If the students know little about Excel, the teacher may need one more lesson to explain and demonstrate how to use the computer to estimate Pi value. Downloadable from the website is a video demonstration about how to use Excel for estimating Pi.
Students measure and analyze forces that act on vehicles pulling heavy objects …
Students measure and analyze forces that act on vehicles pulling heavy objects while moving at a constant speed on a frictional surface. They study how the cars interact with their environments through forces, and discover which parameters in the design of the cars and environments could be altered to improve vehicles' pulling power. This LEGO® MINDSTORMS® based activity is geared towards, but not limited to, physics students.
In this lesson, students will learn how great navigators of the past …
In this lesson, students will learn how great navigators of the past stayed on course that is, the historical methods of navigation. The concepts of dead reckoning and celestial navigation are discussed.
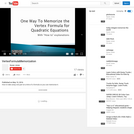
3-minute video about "Symbol Imagery" (taking a picture with your mind) and …
3-minute video about "Symbol Imagery" (taking a picture with your mind) and practice applying that to remember that the x-coordinate of the vertex of a parabola is -b/2a .
An interactive applet and associated web page that provide step-by-step animated instructions …
An interactive applet and associated web page that provide step-by-step animated instructions on how to measure angles using a protractor. Specifically, it uses a protractor to measure two angles that form a vertical pair, verifying they have the same measure. The animation can be run either continuously like a video, or single stepped to allow classroom discussion and thought between steps. Applet can be enlarged to full screen size for use with a classroom projector. This resource is a component of the Math Open Reference Interactive Geometry textbook project at http://www.mathopenref.com.
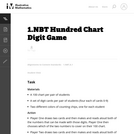
Students learn the patterns in the hundred board by assembling puzzles. Teachers …
Students learn the patterns in the hundred board by assembling puzzles. Teachers are able to assess student use of patterns in rows and columns by observing the student at work. This task is easily differentiated to accommodate the varied levels in a first grade class by changing the number of pieces and the shape of the pieces. Puzzle bags should be sequentially lettered so that students progress through harder versions of the task. Finally, students are asked to create their own puzzles for classmates to solve.
No restrictions on your remixing, redistributing, or making derivative works. Give credit to the author, as required.
Your remixing, redistributing, or making derivatives works comes with some restrictions, including how it is shared.
Your redistributing comes with some restrictions. Do not remix or make derivative works.
Most restrictive license type. Prohibits most uses, sharing, and any changes.
Copyrighted materials, available under Fair Use and the TEACH Act for US-based educators, or other custom arrangements. Go to the resource provider to see their individual restrictions.