This project is modeled after scientific meetings where scientists exchange information via …
This project is modeled after scientific meetings where scientists exchange information via poster presentations. The challenge is to present varied and interesting data accurately, concisely, and attractively in a limited format. For the project, each student prepares a poster showing an analysis of geological data using a spreadsheet. Topics must be approved by the instructor. Students find a data set online, graph some aspect of the data, and summarize the results on a standard poster board (56 x 71 cm or 22 x 28 in). No oral presentation is involved. Posters are graded on their geological content, use of a spreadsheet, use of graphics, and organization. Every poster must incorporate the following elements: an informative title; a table with at least 50 data points, formatted and printed using Microsoft Excel; a graph of the data, created using Microsoft Excel; a 1-page summary of the overall project; at least one picture; at least one map; and three or more references. There are intermediate deadlines during the semester for parts of the poster: the topic and data source; the table and graph; the summary; and the references cited. The poster itself is due at the scheduled final exam time, a three-hour period used as the Poster Review Session where students display their posters for the rest of the class to read. During the Poster Review Session, students read five posters of their choice and answer a series of questions about each one, including a subjective evaluation of Excellent, Good, Fair, or Poor. Reviews affect the grade of the student filling them out but do not affect the grades assigned to the posters themselves; all posters are graded by the instructor.
(Note: this resource was added to OER Commons as part of a batch upload of over 2,200 records. If you notice an issue with the quality of the metadata, please let us know by using the 'report' button and we will flag it for consideration.)
In this lesson, students will learn about how volcanoes and mountains affect …
In this lesson, students will learn about how volcanoes and mountains affect weather. Includes video links, discussion, demonstration, and an additional activity.
Students have learned the rudiments of outcrop evaluation, surveying and mapping of …
Students have learned the rudiments of outcrop evaluation, surveying and mapping of geomorphic features, and the hazards of urbanization in Juneau's glacierized and high relief terrain. Their task in this lab is to assess geologic hazards inherent in the landscape by collecting structural data and making observations at 6 sites with interesting features. They use their field notes as a basis for writing an engineering geology report to the city with their recommendations for site selection for home building.
(Note: this resource was added to OER Commons as part of a batch upload of over 2,200 records. If you notice an issue with the quality of the metadata, please let us know by using the 'report' button and we will flag it for consideration.)
Programs such as Google EarthTM and NASA World Wind provide satellite images …
Programs such as Google EarthTM and NASA World Wind provide satellite images of any point on the planet. These and other tools allow us to build models of the landscape, draw topographic profiles, measure straight-line distances and the length of winding streams, and estimate slope steepness. Why are geologists interested in maps? We use them as the fundamental tool for communicating information about the distribution of rock units and landforms. If you ever go to a national park, you will find topographic and geologic maps of the park area at the visitor center. In fact, you can even download an electronic version of the map showing your neighborhood from the US Geological Survey website. Student materials for this exercise include the instruction sheet and a .zip file containing the topographic map (PDF and JPG versions of the full map plus a PDF for the topographic profile). The exercise is divided into three parts. Part I introduces the concept of a topographic map and the basic information relevant to reading a map. Students determine elevations of points on and off contour lines, including spot elevations, and calculate relief and slope. In Part II, students construct a topographic profile by hand and use it to interpret the landscape along the profile line. Part III involves calculating the fractional horizontal and vertical scales of various profiles and using them to compute vertical exaggeration of examples and of the profile from Part II.
(Note: this resource was added to OER Commons as part of a batch upload of over 2,200 records. If you notice an issue with the quality of the metadata, please let us know by using the 'report' button and we will flag it for consideration.)
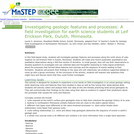
To demonstrate potential links between sedimentation and tectonics students first examine a …
To demonstrate potential links between sedimentation and tectonics students first examine a suite of samples from the southern Appalachians with the goal of interpreting depositional environments and reconstructing a history of relative sea level change. Next, the students compile stratigraphic information for 5 different regions throughout the Appalachian basin and construct burial curves using a sediment backstripping program. The observations and conclusions about sea level change and variable basin subsidence rates are then related to possible tectonic causes to reconstruct the geologic history of the Appalachians.
(Note: this resource was added to OER Commons as part of a batch upload of over 2,200 records. If you notice an issue with the quality of the metadata, please let us know by using the 'report' button and we will flag it for consideration.)
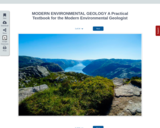
The online geology lab for community college students was developed by Dr. …
The online geology lab for community college students was developed by Dr. Rondi Davies, a faculty member at Queensborough Community College, City University New York, during two years of forced online synchronous learning brought on by the COVID-19 pandemic. This open educational resource collects many of Dr. Davies’ favorite open-access materials and supplements them with her own work within a single, cohesive laboratory manual intended for two-year, non-major college students from the New York area.
This field investigation of bedrock geology allows students to make observations, form …
This field investigation of bedrock geology allows students to make observations, form questions, and conduct research to identify the evidence for volcanism in Minnesota.
This activity guides the students through a set of geological problems related …
This activity guides the students through a set of geological problems related to the Woodlark Basin, Papua New Guinea.
(Note: this resource was added to OER Commons as part of a batch upload of over 2,200 records. If you notice an issue with the quality of the metadata, please let us know by using the 'report' button and we will flag it for consideration.)
The online geology lab for community college students was developed during two years …
The online geology lab for community college students was developed during two years of forced online synchronous learning brought on by the COVID-19 pandemic. This open educational resource is a cohesive laboratory manual intended for two-year, non-major college students from the New York area. Each lab is accompanied by a Teacher’s Guide and an online answer sheet (formatted for the Blackboard learning management system). A multiple-choice format is used for many questions, making the labs easy to grade.
This activity is a field investigation where students observe and interpret the …
This activity is a field investigation where students observe and interpret the rocks types, geologic features, and processes typical to the north shore of Lake Superior. Students use their data to develop questions that could be further investigated and to predict the sequence of events leading to the formation of these rocks and features.
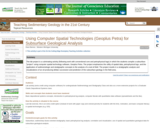
The student compiles oil field well data, including spatial locations and digital …
The student compiles oil field well data, including spatial locations and digital well logs, for analysis of subsurface, oil reservoir stratigraphy and lithology using computer spatial technologies software, Geoplus Petra. The students create well log cross sections, make lithologic picks, construct structure and isopach maps, and evaluate lithologic properties, including gross reservoir quality from petrophysical logs. These data are used to interpret depositional environment of the subject formation and make predictions for well bore perforations for oil production. The key value of the exercise is an introduction to the use of computer software to analyze geological data, guided by sedimentologic and stratigraphic insights, and make predictions for resource exploitation.
(Note: this resource was added to OER Commons as part of a batch upload of over 2,200 records. If you notice an issue with the quality of the metadata, please let us know by using the 'report' button and we will flag it for consideration.)
This is the final project/presentation for undergraduate students in a relatively small …
This is the final project/presentation for undergraduate students in a relatively small introductory geoscience class where most (but not all) students are taking the class to satisfy their lab science requirement. Students are asked to create their own geological teaching demonstration and/or activity geared to high school or college geoscience classes which allows students to deepen their knowledge in a particular area of their interest. The style of the assignment is similar to the labs in the course where the students participation is "requested" in a (fictional) letter of request and they must respond appropriately with a letter of reply as well as completion of the specific assignment (which, in this case, includes the activity/demonstration, Teacher's Notes, Supply List, Geological Background, and Peer Evaluations). In addition to creating this demonstration/activity and write-up, the students much also trial and present their demonstration/activity to the rest of the class, the instructor, and a visiting K-12 environmental scientist in a conference-style session (name-tags and program provided) for evaluation.
(Note: this resource was added to OER Commons as part of a batch upload of over 2,200 records. If you notice an issue with the quality of the metadata, please let us know by using the 'report' button and we will flag it for consideration.)
The concept and name of "lecture tutorials" are not original but come …
The concept and name of "lecture tutorials" are not original but come from Lecture Tutorials for Introductory Geoscience (2012) by Kortz and Smay. These authors define a lecture tutorial as "a short worksheet that students complete in class, making the lecture more interactive." Tutorials were added to a specific course to incorporate interactivity, hold student attention throughout a class session, improve student understanding, and increase attendance. The results are presented in more detail in the Instructors Notes, but adding tutorials to lectures has generally accomplished the goals listed above. The number of lectures with tutorials has increased since the first term of use. This activity contains 26 tutorials, one for each lecture in the course. However, not every tutorial is used in every semester; they are rotated from year to year. Some tutorials are used but not collected for grading. The accompanying PowerPoint slides may be incorporated into the lectures. These slides are written for the clicker option but can also be used with physical handouts after some modification.
(Note: this resource was added to OER Commons as part of a batch upload of over 2,200 records. If you notice an issue with the quality of the metadata, please let us know by using the 'report' button and we will flag it for consideration.)
Students are asked to match up each of the Stooges with their …
Students are asked to match up each of the Stooges with their favorite group and species of dinosaur based on clues given from different perspectives.
(Note: this resource was added to OER Commons as part of a batch upload of over 2,200 records. If you notice an issue with the quality of the metadata, please let us know by using the 'report' button and we will flag it for consideration.)
In this writing assingment, students research and analyze the Dust Bowl. Students …
In this writing assingment, students research and analyze the Dust Bowl. Students analyze data, analyze and integrate different sources of information, and present a well developed written argument.
(Note: this resource was added to OER Commons as part of a batch upload of over 2,200 records. If you notice an issue with the quality of the metadata, please let us know by using the 'report' button and we will flag it for consideration.)
This is a multi-component case study on copper and Peru. It attemps …
This is a multi-component case study on copper and Peru. It attemps to look at a specific mineral resource through multiple lenses, e.g. geology, economics, regulation and political process.
This is an exercise that is in development and has not yet …
This is an exercise that is in development and has not yet been fully tested in the classroom. Please check back regularly for updates and changes.
Students will use a combination of topographic and geologic maps in interpret and analyze natural hazards of the Pu'uO'o eruption.
Brief three-line description of the activity or assignment and its strengths: Students will use a topographic map to plot the direction of lava flow associated with eruptive activity of Kilauea Volcano, in Hawaii. They will assess the natural hazards associated with Kilauea's eruptive and gas activity in order to make predictions and assess the dangers to people and properties in the region.
Full length description:
You are a HVO scientist who will be assessing the natural hazards associated with Kilauea's activity including the dangers to people and properties in the region. There are three parts to this lab assignment: a pre-lab, lab, and news report. The pre-lab should be completed before attending the lab. In the pre-lab you will be asked to look at the style of volcanism associated with Pu'u O'o cone, a cinder-and-spatter cone located in the east rift zone. In the lab you will be provided with 3 topographic and 1 geologic map to assess the natural hazards associated with Kilauea's activity including the dangers to people and properties in the region. You will be responsible for creating your own set of maps and materials from the pre-lab and lab exercises. The third part of the assignment involves writing an accompanying news report to communicate the results of your work to the public. While you are encouraged to discuss all parts of the assignment with your peers, you must hand in your own work.
(Note: this resource was added to OER Commons as part of a batch upload of over 2,200 records. If you notice an issue with the quality of the metadata, please let us know by using the 'report' button and we will flag it for consideration.)
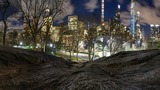
Landscape evolution provides a convenient framework for understanding geologic time and rates …
Landscape evolution provides a convenient framework for understanding geologic time and rates because students can observe how processes like erosion and deposition shape their surroundings, even in urban settings. In order to describe landscapes qualitatively and quantitatively, students build 3-D sandbox models based on topographic maps and design and stage a "virtual adventure race." Sandbox landscapes are used to illustrate erosional processes, the role of water in sediment transport, relief change, and how erosion exhumes rocks from depth, while local examples are used to discuss landscapes as transient or steady over different time- and length scales. To convince students that the observed processes act over millions of years to shape Earth's surface, quantitative dating tools are introduced. Dice experiments illustrate radioactive decay and the shape of the age equation curve, and 14C dating, geochronology and thermochronology are introduced as "stopwatches" that start when a plant dies, a crystal forms, or a rock nears the surface and cools to a certain temperature. The sandbox model and thermochronometer "stopwatches" are combined to measure erosion rates at a point, uniform and spatially variable erosion, and rates of landscape change. Ultimately, model rates (cm/hour) calculated from stopwatch times on the order of seconds can be related to geologic rates (km/My) calculated from real million-year-old samples. SEE POSTER for detailed descriptions of each activity in Parts 1-4 (complete with specific Learning Goals, Context, Materials, Activity Summary, Evaluation, and adaptation to challenge students in grades 9-16).
(Note: this resource was added to OER Commons as part of a batch upload of over 2,200 records. If you notice an issue with the quality of the metadata, please let us know by using the 'report' button and we will flag it for consideration.)
Students visit Drayton Hall historic plantation near Charleston, South Carolina and are …
Students visit Drayton Hall historic plantation near Charleston, South Carolina and are led on a field trip that starts with a discussion of documented historic changes that have affected the mansion and the surrounding property. The field trip continues with a study of Native American artifacts and ends with analysis of coastal plain deposits exposed along the Ashley River. Students use paleogeographic maps to discuss both historic and prehistoric changes to the landscape. Back in the classroom, students gather data to draw paleogeographic maps of their own school site through geologic time.
(Note: this resource was added to OER Commons as part of a batch upload of over 2,200 records. If you notice an issue with the quality of the metadata, please let us know by using the 'report' button and we will flag it for consideration.)
No restrictions on your remixing, redistributing, or making derivative works. Give credit to the author, as required.
Your remixing, redistributing, or making derivatives works comes with some restrictions, including how it is shared.
Your redistributing comes with some restrictions. Do not remix or make derivative works.
Most restrictive license type. Prohibits most uses, sharing, and any changes.
Copyrighted materials, available under Fair Use and the TEACH Act for US-based educators, or other custom arrangements. Go to the resource provider to see their individual restrictions.