This oral communication content includes several types of common college-level presentations including an informative speech, visual aid presentation, …
This oral communication content includes several types of common college-level presentations including an informative speech, visual aid presentation, and Monroe's Motivated Sequence persuasive speech. All of the presentations are for critique and compatible with rubrics that examine basic elements of public speaking. All presentations in this series were delivered by student volunteers as part of a technology fellowship project at the University of Alaska Anchorage. Please note that student presenter first names were included as a way to promote classroom climate and respect when critiquing. It is found that students are more likely to critique in a respectful manner when the example speech presenter is named.
This course discusses the evolution and role of urban public transportation modes, …
This course discusses the evolution and role of urban public transportation modes, systems, and services, focusing on bus and rail. It covers various topics, including current practice and new methods for data collection and analysis, performance monitoring, route design, frequency determination, vehicle and crew scheduling, effect of pricing policy and service quality on ridership.
SYNOPSIS: In this lesson, students learn about extreme weather, create an infographic, …
SYNOPSIS: In this lesson, students learn about extreme weather, create an infographic, and educate others on the knowledge gained from this unit.
SCIENTIST NOTES: This lesson allows students to understand the difference between weather and climate, the important variables that cause changes in weather, how weather and climate are predicted, the impact of weather extremes on the climate, and how human activities have accelerated wildfires, disrupted the water cycle, and caused other erratic weather disturbances in their communities. They would be able to explore which weather events are frequent and the overall combined impacts. All materials were rigorously reviewed, and this lesson has passed our science credibility process.
POSITIVES: -Students participate in multiple interactive and hands-on learning activities to engage in kinesthetic, auditory, and visual learning. -Students have an opportunity to share their growth and knowledge throughout the unit with other students and community members.
ADDITIONAL PREREQUISITES: -This is lesson 4 of 4 in our 6th-8th grade Water Cycle, Deforestation, and Climate Change unit. -Teachers need to determine how to choose the best course of action for sharing student learning. Options include the following: -Class vote -Teacher predetermines based on their best judgment -Student panel is created -Different groups choose different courses of action
DIFFERENTIATION: -Students may use the Emotions Board for vocabulary support as they watch the videos in the Inquire section -At the end of the unit, a classroom gallery walk is recommended. -Some ideas for extensions at the end of the unit include: -Inviting other classes in for a gallery walk -Hosting a community night where community members can be educated on what students have learned in the unit -Mailing student materials to different leaders in the community, particularly leaders that are in charge of the local water sources
This is an in-depth activity that focuses on Wisconsin ecosystem characteristics and …
This is an in-depth activity that focuses on Wisconsin ecosystem characteristics and energy flow within ecosystems. The activity is lengthy, but selected parts of it could be adapted to a variety of teaching situations.
The general assignment is for the students to work as a team …
The general assignment is for the students to work as a team to quantify and map the variability in greenhouse gas emissions for the counties in Washington State. To accomplish this, students work in pairs throughout the quarter, sharing their findings on Blackboard along the way. Each pair is assigned a specific parameter (for example, cattle emissions) and it is their task to: 1) determine how to calculate the carbon dioxide equivalent emissions for their parameter; 2) find the data to plug into their formula(s); 3) list the sources of their information; 4) generate maps comparing the emissions of their parameter in each WA county; and 5) assess the assumptions and sources of uncertainty in their calculations. Near the end of the quarter all students are challenged to evaluate the work of all student pairs and decide which student data sets to use in calculating total emissions for each county. Aside from having to critically evaluate the data available to them, the students also have to justify the choices they make in generating their total emissions per county and how they display the data on a map.
(Note: this resource was added to OER Commons as part of a batch upload of over 2,200 records. If you notice an issue with the quality of the metadata, please let us know by using the 'report' button and we will flag it for consideration.)
Several factors contributed to the extreme flooding that occurred in Boulder, Colorado …
Several factors contributed to the extreme flooding that occurred in Boulder, Colorado in 2013. In this data activity, students explore and visualize the data for stream discharge data collected by the United States Geological Survey (USGS).
Students analyze a Quaternary pollen diagram from lakes in Bladen County, NC. …
Students analyze a Quaternary pollen diagram from lakes in Bladen County, NC. This diagram contains (from the top down) the current deglaciation, the last glacial, and the previous interglacial. Students These lakes occur in Carolina Bays and students also evaluate a proposal that meteorite impact created the Bays.
(Note: this resource was added to OER Commons as part of a batch upload of over 2,200 records. If you notice an issue with the quality of the metadata, please let us know by using the 'report' button and we will flag it for consideration.)
This article from Beyond Weather and the Water Cycle provides ideas on …
This article from Beyond Weather and the Water Cycle provides ideas on how school librarians can work with elementary teachers to teach about the Sun's impact on weather and climate. The author introduces the Standards for the 21st Century Learner, developed by the American Association of School Librarians. The author focuses on Standard 1, which calls for students to inquire, think critically, and gain knowledge through developing and refining questions, investigating answers, seeking divergent perspectives in information, and assessing whether the information found answers the questions posed. The free, online magazine draws its themes from the Seven Essential Principles of Climate Literacy, with each issue focusing on one of the seven principles.
As the threats of tsunami and sea level rise are joined by …
As the threats of tsunami and sea level rise are joined by real and potential climate impacts, the Quinault community looks to move the lower village of Taholah to higher ground.
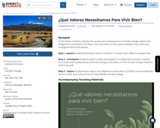
SYNOPSIS: In this lesson, students identify the causes and consequences of climate …
SYNOPSIS: In this lesson, students identify the causes and consequences of climate change, explore the Indigenous cosmovision of El Buen Vivir, and reflect on the values needed to live within the ecological limits of the planet.
SCIENTIST NOTES: The lesson highlights the importance of protecting nature and recognizes the role played by Indigenous Peoples in protecting biodiversity and living well with nature. Students will find this lesson promising and insightful as it prepares them to be environmental stewards. All the materials are credible, and this lesson is recommended for teaching.
La lección destaca la importancia de proteger la naturaleza y reconoce el papel que juegan los pueblos indígenas en la protección de la biodiversidad y vivir bien con la naturaleza. Los estudiantes encontrarán esta lección prometedora y perspicaz, ya que los prepara para ser administradores ambientales. Todos los materiales tienen buenas fuentes y esta lección se recomienda para la enseñanza.
POSITIVES: -This lesson integrates interpersonal and presentational speaking skills with listening and reading activities from authentic Spanish-language sources. -Students make interdisciplinary connections to science and global challenges. -Students explore the diversity of Indigenous cultures in Latin America and are exposed to women who are Indigenous leaders. -Many activities are student-led and reinforce new vocabulary in multi-modal ways. -Answer keys are provided for the listening activities. -The teacher can leave the posters or artwork visible in the classroom to refer back to when discussing values related to other topics or units later in the year.
ADDITIONAL PREREQUISITES: -Students should have a minimum of novice-high proficiency to complete the activities in this lesson. -Students should have a basic understanding of some natural cycles of the Earth in order to complete the activity in the Investigate section without teacher support.
DIFFERENTIATION: -Teachers can divide this lesson into two or more class periods as needed. For example, students can complete the Inquire and Investigate sections in one class period, complete the reading and video comprehension activities for homework, then complete the Inspire section in a second class period. -Teachers can extend the Inspire section to two class periods to accommodate in-class presentations or ask students to record their presentations for homework.
In this lesson, students identify the causes and consequences of climate change, …
In this lesson, students identify the causes and consequences of climate change, explore the Indigenous cosmovision of El Buen Vivir, and reflect on the values needed to live within the ecological limits of the planet.
Step 1 - Inquire: Students brainstorm what it means to “live well” from different perspectives.
Step 2 - Investigate: Students watch a video, participate in a collaborative activity to explore the causes and consequences of climate change, and reflect on how climate change interferes with living well.
Step 3 - Inspire: Students learn about the Indigenous cosmovision of El Buen Vivir and identify values in their own culture that can help address climate change.
Students build a watershed model to define what a watershed is, identify …
Students build a watershed model to define what a watershed is, identify the different parts within a watershed, and discover how water moves within a watershed. After learning Best Management Practices and mitigation techniques, students rebuild their models.
How does energy flow in and out of our atmosphere? Explore how …
How does energy flow in and out of our atmosphere? Explore how solar and infrared radiation enters and exits the atmosphere with an interactive model. Control the amounts of carbon dioxide and clouds present in the model and learn how these factors can influence global temperature. Record results using snapshots of the model in the virtual lab notebook where you can annotate your observations.
Groups of 3-4 students work in parallel on different radiocarbon data sets …
Groups of 3-4 students work in parallel on different radiocarbon data sets in this project assignment; the content described here would comprise one group data set including a brief descriptive statement and bibliographic reference, raw data including errors, background lecture notes, and an example final poster presentation.
(Note: this resource was added to OER Commons as part of a batch upload of over 2,200 records. If you notice an issue with the quality of the metadata, please let us know by using the 'report' button and we will flag it for consideration.)
In this lesson, students will examine the amount of annual and seasonal …
In this lesson, students will examine the amount of annual and seasonal rainfall in four cities to compare decimals to the hundredths place. Students will add and round digits to the thousandths place. Students will utilize technology by navigating to a specific United States climate website to get relatively current and accurate data. This unit was created as part of the ALEX Interdisciplinary Resource Development Summit.
In this hands-on inquiry-based activity, students face an engineering challenge based on …
In this hands-on inquiry-based activity, students face an engineering challenge based on real-world applications. They are tasked with developing a tool they can use to measure the amount of rain that falls each day. This is more of a mini unit than a stand alone activity.
The students are asked to identify the drainage area at which channels …
The students are asked to identify the drainage area at which channels begin on the island of Hawaii. Using ARC GIS, they are asked to create a slope, contour, and hillshade map. They use these maps as a guide to create river shape files with different drainage area thresholds in order to identify the proper threshold or thresholds. They are then given a map of the actual river locations and a precipitation map. The students must hand in their maps along with a write-up that describes how they used the slope, contour and hillshade maps to determine the location of rivers. They must also report on what drainage area threshold(s) they chose and why. They are also asked to explain why the map of the actual river locations looks different from any of river maps that they created. This activity gives students practice at interpreting and synthesizing multiple data sets. Designed for a geomorphology course Uses online and/or real-time data
(Note: this resource was added to OER Commons as part of a batch upload of over 2,200 records. If you notice an issue with the quality of the metadata, please let us know by using the 'report' button and we will flag it for consideration.)
No restrictions on your remixing, redistributing, or making derivative works. Give credit to the author, as required.
Your remixing, redistributing, or making derivatives works comes with some restrictions, including how it is shared.
Your redistributing comes with some restrictions. Do not remix or make derivative works.
Most restrictive license type. Prohibits most uses, sharing, and any changes.
Copyrighted materials, available under Fair Use and the TEACH Act for US-based educators, or other custom arrangements. Go to the resource provider to see their individual restrictions.