Repeated motion is present everywhere in nature. Learn how to 'make waves' …
Repeated motion is present everywhere in nature. Learn how to 'make waves' with your own movements using a motion detector to plot your position as a function of time, and try to duplicate wave patterns presented in the activity. Investigate the concept of distance versus time graphs and see how your own movement can be represented on a graph.
This task requires students to study the make-a-ten strategy that they should …
This task requires students to study the make-a-ten strategy that they should already know and use intuitively. In this strategy, knowledge of which sums make a ten, together with some of the properties of addition and subtraction, are used to evaluate sums which are larger than 10.
Making a 10 provides a technique to help students master single digit …
Making a 10 provides a technique to help students master single digit addition. The task is designed to help students visualize where the 10's are on a single digit addition table and explain why this is so. This knowledge can then be used to help them learn the addition table.
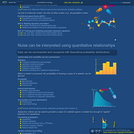
Graph theory is a visual way to represent relationships between objects. One …
Graph theory is a visual way to represent relationships between objects. One of the simplest uses of graph theory is a family tree that shows how different people are related. Another application is social networks like Facebook, where a network of "friends" and their "friends" can be represented using graphs. Students learn and apply concepts and methods of graph theory to analyze data for different relationships such as friendships and physical proximity. They are asked about relationships between people and how those relationships can be illustrated. As part of the lesson, students are challenged to find the social graph of their friends. This prepares students for the associated activity during which they simulate and analyze the spread of disease using graph theory by assuming close proximity to an infected individual causes the disease to spread.
Making up Numbers will be of great interest to undergraduate and A-level …
Making up Numbers will be of great interest to undergraduate and A-level students of mathematics, as well as secondary school teachers of the subject. In virtue of its detailed treatment of mathematical ideas, it will be of value to anyone seeking to learn more about the development of the subject.
Introductory Statistics is a non-calculus based, descriptive statistics course with applications. …
Introductory Statistics is a non-calculus based, descriptive statistics course with applications. Topics include methods of collecting, organizing, and interpreting data; measures of central tendency, position, and variability for grouped and ungrouped data; frequency distributions and their graphical representations; introduction to probability theory, standard normal distribution, and areas under the curve. Course materials created by Fahmil Shah, content added to OER Commons by Victoria Vidal.
Students will explore exponential growth, sustainability, population trends, and social responsibility as …
Students will explore exponential growth, sustainability, population trends, and social responsibility as observed in various texts relating to U.S. Westward Expansion.
Spreadsheets Across the Curriculum Module. Students build spreadsheets to estimate discharge for …
Spreadsheets Across the Curriculum Module. Students build spreadsheets to estimate discharge for a culvert using the Manning equation, and to estimate culvert size, given a specified discharge.
This task provides three types of comparison problems: Those with an unknown …
This task provides three types of comparison problems: Those with an unknown difference and two known numbers; those with a known difference and a bigger unknown number; and those with a known difference and smaller unknown number. Students may solve each type using addition or subtraction, although the language in specific problems tends to favor one approach over another.
This book contains 24 illustrated math problem sets based on a weekly …
This book contains 24 illustrated math problem sets based on a weekly series of space science problems. Each set of problems is contained on one page. The problems were created to be authentic glimpses of modern science and engineering issues, often involving actual research data. Learners will use mathematics to explore problems that include basic scales and proportions, fractions, scientific notation, algebra, and geometry.
This activity will take complex molecules and polyatomic ions the students have …
This activity will take complex molecules and polyatomic ions the students have learned and construct them out of marshmallows and redhots. This develops understanding in VESPR structures and hybrid molecules.
This lesson is a classroom activity where students learn about paleontologist Mary …
This lesson is a classroom activity where students learn about paleontologist Mary Anning, briefly learn about sedimentary rock, and complete observation drawings of Platteville Limestone fossils.
In the first part of this video, we derive the law of …
In the first part of this video, we derive the law of mass action from one example of a picture of molecular collisions. For this course, we use the "law of mass action" to refer to an idea that chemical reaction kinetic rates can be expressed using products of the abundances of reactants raised to exponents. Studying cooperativity and Hill functions in the second part of the video allows us to investigate a simple example of bistability in the third video segment.
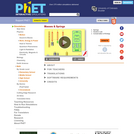
A realistic mass and spring laboratory. Hang masses from springs and adjust …
A realistic mass and spring laboratory. Hang masses from springs and adjust the spring stiffness and damping. You can even slow time. Transport the lab to different planets. A chart shows the kinetic, potential, and thermal energy for each spring.
Students learn about slope, determining slope, distance vs. time graphs through a …
Students learn about slope, determining slope, distance vs. time graphs through a motion-filled activity. Working in teams with calculators and CBL motion detectors, students attempt to match the provided graphs and equations with the output from the detector displayed on their calculators.
Math 083 OER Lesson Packet Fall 2018. Derived from Quantway Version 1.0, …
Math 083 OER Lesson Packet Fall 2018. Derived from Quantway Version 1.0, developed by the Charles A. Dana Center at The University of Texas at Austin under sponsorship of the Carnegie Foundation for the Advancement of Teaching; Revised by the Pierce College Math Department; Revised by the Seattle Central College Math Department; Revised by Kelly Nguyen, Justin Tolentino, Richard Corp and Roy Shahbazian at Santa Ana College licensed under a Creative Commons Attribution-NonCommercial-ShareAlike 3.0 Unported License .The Study Skills are developed by Jessica Bernards at Portland Community College and Mark DeSmet Cabrillo College and a licensed under a Creative Commons Attribution-NonCommercial-ShareAlike license.
No restrictions on your remixing, redistributing, or making derivative works. Give credit to the author, as required.
Your remixing, redistributing, or making derivatives works comes with some restrictions, including how it is shared.
Your redistributing comes with some restrictions. Do not remix or make derivative works.
Most restrictive license type. Prohibits most uses, sharing, and any changes.
Copyrighted materials, available under Fair Use and the TEACH Act for US-based educators, or other custom arrangements. Go to the resource provider to see their individual restrictions.