15.975 U-Lab: Leading Profound Innovation for a More Sustainable World is an …
15.975 U-Lab: Leading Profound Innovation for a More Sustainable World is an interactive and experiential class about leading profound innovation for pioneering a more sustainable economy and society. The class is organized around personal reflection practices, relational practices, and societal practices. It focuses on the intertwined relationship between the evolution of capitalism, multi-stakeholder innovation, and presencing.
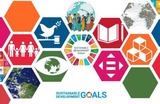
Developed by the World Affairs Council of Seattle, this teaching and learning …
Developed by the World Affairs Council of Seattle, this teaching and learning module provides a series of lessons that engage students in exploring the United Nations Sustainable Development Goals. With 17 goals in total, this ambitious framework targets local and global issues ranging from ensuring quality education for all to mitigating climate change.You will find the student-specific instructions provide appropriate translations to assist teachers and students of heritage languages. Overall, these lessons will support students in developing the knowledge, skills, and dispositions that will prepare them for college, career, and civic life.
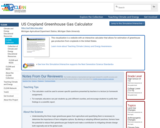
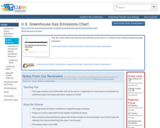
This visualization is a website with an interactive calculator that allows for …
This visualization is a website with an interactive calculator that allows for estimation of greenhouse gas production from croplands in the United States.
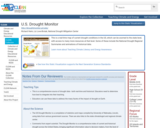
This is a real-time map of current drought conditions in the US, …
This is a real-time map of current drought conditions in the US, which can be zoomed to the state level, with access to many more resources at that level. Some of these include the National Drought Regional Summaries and animations of historical data.
EPA has many data sources available, these cover topics including but not …
EPA has many data sources available, these cover topics including but not limited to air, climate change, health risks, pollutants and contaminants, waste, and water. The data are downloadable and available through the Environmental Dataset Gateway (EDG). The EDG is a source of Web-based geospatial information and information services. It enables data consumers to discover, view, and access geospatial resources made available by EPA's program offices, regions, and labs.
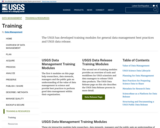
These six interactive modules help researchers, data stewards, managers and the public …
These six interactive modules help researchers, data stewards, managers and the public gain an understanding of the value of data management in science and provide best practices to perform good data management within their organization.
Acknowledgments The USGS Data Management Training modules were funded by the USGS Community for Data Integration and the USGS Office of Organizational and Employee Development's Technology Enabled Learning Program in collaboration with Bureau of Land Management, California Digital Library, and Oak Ridge National Laboratory. Special thanks to Jeffrey Morisette, Dept. of the Interior North Central Climate Science Center; Janice Gordon, USGS Science Analytics and Synthesis; National Indian Programs Training Center; and Keith Kirk, USGS Office of Science Quality Information.
Cite: U.S. Geological Survey, 2021, USGS Data Management Website: U.S. Geological Survey, https://doi.org/10.5066/F7MW2G15.
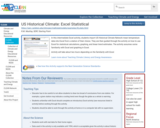
In this intermediate Excel activity, students import US Historical Climate Network mean …
In this intermediate Excel activity, students import US Historical Climate Network mean temperature data into Excel from a station of their choice. They are then guided through the activity on how to use Excel for statistical calculations, graphing, and linear trend estimates. The activity assumes some familiarity with Excel and graphing in Excel.
U.S. History is designed to meet the scope and sequence requirements of …
U.S. History is designed to meet the scope and sequence requirements of most introductory courses. The text provides a balanced approach to U.S. history, considering the people, events, and ideas that have shaped the United States from both the top down (politics, economics, diplomacy) and bottom up (eyewitness accounts, lived experience). U.S. History covers key forces that form the American experience, with particular attention to issues of race, class, and gender.Senior Contributing AuthorsP. Scott Corbett, Ventura CollegeVolker Janssen, California State University, FullertonJohn M. Lund, Keene State CollegeTodd Pfannestiel, Clarion UniversityPaul Vickery, Oral Roberts UniversitySylvie Waskiewicz
By the end of this section, you will be able to:Understand how …
By the end of this section, you will be able to:Understand how the economic and political climate of the day promoted the formation of the farmers’ protest movement in the latter half of the nineteenth centuryExplain how the farmers’ revolt moved from protest to politics
U.S. History is designed for a two-semester American history sequence. It is …
U.S. History is designed for a two-semester American history sequence. It is traditional in coverage, following a roughly chronological outline, and using a balanced approach that includes political, economic, social, and cultural developments. At the same time, the book includes a number of innovative and interactive features designed to enhance student learning. Instructors can also customize the book, adapting it to the approach that works best in their classroom.
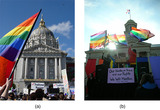
By the end of this section, you will be able to:Describe the …
By the end of this section, you will be able to:Describe the efforts to reduce the influence of immigrants on American cultureDescribe the evolution of twenty-first-century American attitudes towards same-sex marriageExplain the clash over climate change
This article profiles Dr. Leonid Polyak, a senior research scientist with the …
This article profiles Dr. Leonid Polyak, a senior research scientist with the Byrd Polar Research Center, The Ohio State University, who studies seafloor sediments from the Arctic Ocean to find clues about the climate conditions of the past.
Stanford University’s Understand Energy Learning Hub provides free access to Stanford course …
Stanford University’s Understand Energy Learning Hub provides free access to Stanford course content on energy resources from fossil fuels like oil and coal to renewable resources like the wind, the sun, and efficiency; energy currencies like electricity and hydrogen; and energy services such as transportation and buildings. Explore the Hub and build your energy literacy to address climate change and sustainability issues, engage on equity and human development challenges, participate in energy industry markets and technology innovations, and make informed energy decisions.
This activity teaches students about the albedo of surfaces and how it …
This activity teaches students about the albedo of surfaces and how it relates to the ice-albedo feedback effect. During an experiment, students observe the albedo of two different colored surfaces by measuring the temperature change of a white and black surface under a lamp.
This list of children's books recommends nonfiction titles that supplement basic information …
This list of children's books recommends nonfiction titles that supplement basic information found in lessons and activities of this themed issue of the online magazine Beyond Weather and the Water Cycle. The books are grouped by topic -- water, weather and climate, and atmosphere. Each book is described by its content, reading level, and possible uses in the classroom. Covers are pictured. The online magazine is produced for elementary school teachers and is structured around the essential principles of climate sciences and climate literacy.
This interactive module allows students and educators to build models that explain …
This interactive module allows students and educators to build models that explain how the Earth system works. The Click and Learn application can be used to show how Earth is affected by human activities and natural phenomena.
This module contains five activities, in increasing complexity, that focus on understanding …
This module contains five activities, in increasing complexity, that focus on understanding how to interpret and manipulate sea level data, using real data from NOAA. Students first need to understand how to access and interpret sea surface height and tide data. To understand how to interpret these data, students will review and practice computing mean values. Along the way, they will learn how different factors, such as storms, affect tide levels and how to measure them. The goal is for students to become experienced with these kinds of data and the tools for accessing them so that, by the end of the module, they can continue to explore data sets driven by their own inquiry.
SYNOPSIS: This lesson introduces the concept of weather to students. SCIENTIST NOTES: …
SYNOPSIS: This lesson introduces the concept of weather to students.
SCIENTIST NOTES: Observing the weather to track changes is an important activity. This lesson allows students to understand the local weather and observe the patterns and their impact on their daily activities and the environment. All materials are suitable techniques for qualitative weather forecasting. On that account, this lesson has passed our scientific credibility process and is recommended for teaching.
POSITIVES: -This lesson creates a collaborative learning environment for students as they are introduced to weather and its importance. -This lesson features sensory learning as students use their five senses to make observations about the weather. -This lesson features excellent vocabulary development. -This lesson provides an introduction to the relationship between climate and weather.
ADDITIONAL PREREQUISITES: -You can place a thermometer in an easily accessed outside location (e.g., near the recess area) and check the temperature daily. -It is necessary to print the weather journal and weather wheel ahead of time.
DIFFERENTIATION: -You can have students think-pair-share during the read aloud. Students can make predictions or answer questions. -You can pause the read aloud before the text is read for students to make observations and predictions about the story. -Groups of students with mixed abilities can collaborate on their weather wheel and their future climate prediction. -Possible Extension: Work with the school administration to find a way for students to share a daily weather report with the school (e.g., live morning assembly, email blast, TV announcement, etc.).
No restrictions on your remixing, redistributing, or making derivative works. Give credit to the author, as required.
Your remixing, redistributing, or making derivatives works comes with some restrictions, including how it is shared.
Your redistributing comes with some restrictions. Do not remix or make derivative works.
Most restrictive license type. Prohibits most uses, sharing, and any changes.
Copyrighted materials, available under Fair Use and the TEACH Act for US-based educators, or other custom arrangements. Go to the resource provider to see their individual restrictions.