In this activity, students model the impact of land-cover changes on stormwater …
In this activity, students model the impact of land-cover changes on stormwater runoff using the EPA's National Stormwater Calculator (Calculator). The students are introduced to the Calculator through a tutorial. Students are provided with a particular site -- a residential neighborhood -- and model two land-use scenarios associated with it: (1) a pre-expansion scenario that includes current forest and developed land cover, and (2) a post-expansion scenario, under which the forest cover will be developed as low-intensity residential.
(Note: this resource was added to OER Commons as part of a batch upload of over 2,200 records. If you notice an issue with the quality of the metadata, please let us know by using the 'report' button and we will flag it for consideration.)
Kinematic GNSS surveys can provide a rapid means of collecting widely distributed, …
Kinematic GNSS surveys can provide a rapid means of collecting widely distributed, high-precision topographic data. The advantages of this technique over optical instruments such as a total station are that it only requires one person to operate and it does not rely on maintaining a direct line of site. Once points are collected, students will learn to interpolate them using ArcMap to create a continuous model of elevations. Students must think carefully about where they collect their points and evaluate the merits of different interpolation techniques including TIN and Kriging. Through a field-based application of kinematic GNSS, students will design and conduct a topographic survey and interpolate collected points to create a continuous elevation field. This builds upon skills learned in Unit 2 and prepares students for future techniques such as surface differencing and topographic change detection (Unit 2.2).
Show more information on GPS versus GNSS Hide Note: Although the term GPS (Global Positioning System) is more commonly used in everyday language, it officially refers only to the USA's constellation of satellites. GNSS (Global Navigation Satellite System) is a universal term that refers to all satellite navigation systems including those from the USA (GPS), Russia (GLONASS), European Union (Galileo), China (BeiDou), and others. In this module, we use the term GNSS to refer generically to the use of one or more satellite constellations to determine position.
(Note: this resource was added to OER Commons as part of a batch upload of over 2,200 records. If you notice an issue with the quality of the metadata, please let us know by using the 'report' button and we will flag it for consideration.)
Though it may be difficult to perceive, landscapes are constantly changing form …
Though it may be difficult to perceive, landscapes are constantly changing form and position. High-precision GNSS is one of a handful of techniques capable of quantifying these changes and is a key component of many modern geologic, biologic, and engineering studies. In this unit, students will learn how to approach a study in change detection in the context of a geomorphic or structural problem, then design and implement a GNSS survey that effectively explores the problem. Through field-based application of kinematic GNSS techniques, students will design, execute, and analyze data from a survey to detect change. Students design the survey based on a question of scientific or societal impetus and are asked to defend their design and implementation. This is the final unit focused on kinematic GNSS and is aimed at solidifying students knowledge and technical skill in this technique.
Show more information on GPS versus GNSS Hide Note: Although the term GPS (Global Positioning System) is more commonly used in everyday language, it officially refers only to the USA's constellation of satellites. GNSS (Global Navigation Satellite System) is a universal term that refers to all satellite navigation systems including those from the USA (GPS), Russia (GLONASS), European Union (Galileo), China (BeiDou), and others. In this module, we use the term GNSS to refer generically to the use of one or more satellite constellations to determine position.
(Note: this resource was added to OER Commons as part of a batch upload of over 2,200 records. If you notice an issue with the quality of the metadata, please let us know by using the 'report' button and we will flag it for consideration.)
In this activity, students model the impact of changes in land cover …
In this activity, students model the impact of changes in land cover on stormwater runoff using the EPA's National Stormwater Calculator. Students mitigate increased stormwater runoff resulting from development with low impact development (LID) controls. Students assess the LID controls in terms of the ecosystem services that they are intended to replace and discuss alternative development designs to reduce the need for them.
(Note: this resource was added to OER Commons as part of a batch upload of over 2,200 records. If you notice an issue with the quality of the metadata, please let us know by using the 'report' button and we will flag it for consideration.)
In this activity, students model the impact of a proposed land-use change …
In this activity, students model the impact of a proposed land-use change for a local site using the EPA's National Stormwater Calculator (Calculator). Given a description of the proposed land-use change, students devise and execute a series of simulations in the Calculator that model its potential impact on stormwater retention. Using additional simulations, students explore changes to the site that utilize low impact development (LID) controls to mitigate stormwater runoff.
(Note: this resource was added to OER Commons as part of a batch upload of over 2,200 records. If you notice an issue with the quality of the metadata, please let us know by using the 'report' button and we will flag it for consideration.)
In Unit 2, students apply and evaluate foundational concepts about storm hazards …
In Unit 2, students apply and evaluate foundational concepts about storm hazards and risk in the context of two cases studies: Superstorm Sandy (2012) and the Storm of the Century (1993). Through different activities and assignments, students develop skills for finding, evaluating, and relating data to case studies and build an understanding of preparedness, response, and resilience. The activities include: an analysis of hazard mitigation plans for their local community, examination of storm-related geophysical processes in the context of societal risks, preparation of a press release for community preparedness, and a peer review and revision opportunity for the press releases. Instructors may also end this unit by having students revise their concept maps from Unit 1, applying lessons learned in Units 1 and 2.
(Note: this resource was added to OER Commons as part of a batch upload of over 2,200 records. If you notice an issue with the quality of the metadata, please let us know by using the 'report' button and we will flag it for consideration.)
This unit provides students with experience analyzing traditional (depth to water table …
This unit provides students with experience analyzing traditional (depth to water table measured in a well) and geodetic: GRACE (Gravity Recovery and Climate Experiment) data for monitoring changes in groundwater storage in the High Plains Aquifer. Variations across timescales are compared, from seasonal to interannual to decadal. This comparison highlights some of the challenges associated with quantifying changes in groundwater storage at the regional scale. Aquifer properties are used to consider changes in terms of both "depth to water table" and water storage. Students are asked to formulate explanations for the observed variations in the context of the water balance equation. Students compare their results to a multidecadal trend reported in the literature (Konikow, 2011).
Show more about Online Teaching suggestions Hide Online-ready: The exercise is electronic and could be done individually or in small online groups. Lecture is best done synchronously due to the technical nature. Discussion would be better that way too.
(Note: this resource was added to OER Commons as part of a batch upload of over 2,200 records. If you notice an issue with the quality of the metadata, please let us know by using the 'report' button and we will flag it for consideration.)
This unit investigates the role of the atmosphere on incoming solar and …
This unit investigates the role of the atmosphere on incoming solar and outgoing terrestrial radiation and analyzes modern trends in greenhouse gas concentrations. Students first investigate radiation spectra to see how the atmosphere absorbs radiation in different parts of the electromagnetic spectrum. This information is used to develop the idea of greenhouse warming. Students then use the atmospheric CO2 dataset from Mauna Loa to investigate changes in atmospheric CO2 through time, and the drivers behind these changes. Follow-up questions ask students to consider how their own daily activities contribute to atmospheric CO2, and how rising CO2 may trigger potential feedbacks in the Earth system.
(Note: this resource was added to OER Commons as part of a batch upload of over 2,200 records. If you notice an issue with the quality of the metadata, please let us know by using the 'report' button and we will flag it for consideration.)
Geodetic survey techniques, such as TLS and SfM featured here, have many …
Geodetic survey techniques, such as TLS and SfM featured here, have many applications in sedimentology research, including lithological identification and analysis, sediment surface topography, and sequence stratigraphy. In this unit, students will design a survey of a geologic outcrop to conduct a sequence stratigraphy analysis. After conducting the survey in the field, students will analyze the parasequences found within the outcrop by mapping and measuring section thickness in the point cloud. The goal is to calculate deposition duration and sedimentation rate based on thicknesses extracted from the data.
(Note: this resource was added to OER Commons as part of a batch upload of over 2,200 records. If you notice an issue with the quality of the metadata, please let us know by using the 'report' button and we will flag it for consideration.)
Electrical measurement of unconsolidated soils in the laboratory. Provenance: Lee Slater, Rutgers …
Electrical measurement of unconsolidated soils in the laboratory.
Provenance: Lee Slater, Rutgers University-Newark Reuse: This item is in the public domain and maybe reused freely without restriction. Archie (1950) defined the term petrophysics to describe the study of the physics of rocks, particularly with respect to the fluids they contain. Although originally focused on geophysical exploration, petrophysics concepts are now used to interpret near surface geophysics measurements made to address environmental and engineering problems. This unit investigates relationships between these geophysical measurements and the physical and chemical properties of soils and sediments in the Earth's near subsurface. The specific focus is on the electrical properties of soils and how they are related to the ionic concentration of the pore fluids, the water content, porosity and grain size. Field results from a geophysical survey performed in Kearny Marsh, close to Harrier Meadow, are included to illustrate how electrical conductivity of a soil measured with an electromagnetic sensor is a good proxy for pore fluid ionic concentration, in this case related to contamination from a bordering landfill.
(Note: this resource was added to OER Commons as part of a batch upload of over 2,200 records. If you notice an issue with the quality of the metadata, please let us know by using the 'report' button and we will flag it for consideration.)
What is the contribution of seawater thermal expansion to recent sea-level rise? …
What is the contribution of seawater thermal expansion to recent sea-level rise? In this unit, students create time-series graphs of global averaged sea surface temperature anomaly (SSTA) data spanning 1880 -- 2017 and conduct linear trend analysis to assess SST change during this period. Based on the calculated SST change, students calculate how much sea-level rise occurred during 1993 -- 2015 due to thermal expansion of the oceans. Students compare their thermal expansion calculated sea-level rise results to observed sea-level rise from radar altimetry and assess how much sea-level rise is attributable to thermal expansion.
Show more about Online Teaching suggestions Hide Online-ready: The exercise is electronic and could be done individually or in small online groups. Lecture is best done synchronously due to the technical nature. Discussion would be better that way too.
(Note: this resource was added to OER Commons as part of a batch upload of over 2,200 records. If you notice an issue with the quality of the metadata, please let us know by using the 'report' button and we will flag it for consideration.)
This unit presents core underlying principles needed to understand refraction seismology concepts …
This unit presents core underlying principles needed to understand refraction seismology concepts including refraction of rays, types of seismic waves, interpreting information about subsurface materials from seismic properties and developing conceptual models of the subsurface environment.
(Note: this resource was added to OER Commons as part of a batch upload of over 2,200 records. If you notice an issue with the quality of the metadata, please let us know by using the 'report' button and we will flag it for consideration.)
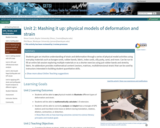
Students gain an intuitive understanding of strain and deformation through a series …
Students gain an intuitive understanding of strain and deformation through a series of physical model activities using everyday materials such as bungee cords, rubber bands, fabric, index cards, silly putty, sand, and more. Can be run to fill an entire lab session exploring multiple materials or as a shorter exercise using just rubber bands and stretchy fabric. An addendum provides mathematical content (vectors, matrices, multidimensional strain) that can be used by instructors interested in building student quantitative skills.
Show more about Online Teaching suggestions Hide Not online recommended: Exercise uses variety of physical models that would be hard to duplicate at home. The first part of the "basic" version of the exercise (as opposed to "extended") does use rubber bands and could potentially be done remotely.
(Note: this resource was added to OER Commons as part of a batch upload of over 2,200 records. If you notice an issue with the quality of the metadata, please let us know by using the 'report' button and we will flag it for consideration.)
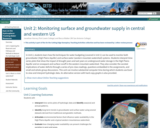
In Unit 2, students learn how the techniques for water budgeting (covered …
In Unit 2, students learn how the techniques for water budgeting (covered in Unit 1) can be used to monitor both groundwater (High Plains Aquifer) and surface water (western mountain watershed) systems. Students interpret time-series plots that show the impact of drought years and wet years on underground water storage in the High Plains Aquifer and on snowpack and surface runoff in the western mountain watershed. They also consider the societal implications of water deficits through a series of pre-class readings, questions embedded in the assignments, and small and whole-group discussions. This unit can involve substantial computer time during which students use Excel to view and interpret hydrologic data. An alternative version with hard-copy graphs is also provided.
Show more about Online Teaching suggestions Hide Online-adaptable: Both parts of this unit are completely digital and thus at a logistical level it can be switched to online fairly easily. However, due to the relative complexity of the data investigations, there will still be quite a bit of instructor support needed and/or extended small group that should be arranged.
(Note: this resource was added to OER Commons as part of a batch upload of over 2,200 records. If you notice an issue with the quality of the metadata, please let us know by using the 'report' button and we will flag it for consideration.)
Students will be provided with seawater pH and carbon dioxide concentration (pCO2) …
Students will be provided with seawater pH and carbon dioxide concentration (pCO2) data spanning as far back as 1850. They will describe trends in pH, pCO2 and atmospheric CO2 concentration, outline why these parameters are related, and predict how changes in these parameters will affect marine biology. Each group of students will be given a different set of data from different regions and asked to compare with other groups to determine if seawater pH change is a global or regional phenomena. This unit will provide students with an understanding of the pH buffering system and an opportunity to interpret real climate data.
(Note: this resource was added to OER Commons as part of a batch upload of over 2,200 records. If you notice an issue with the quality of the metadata, please let us know by using the 'report' button and we will flag it for consideration.)
Students will collect and analyze relevant social data on individual and community …
Students will collect and analyze relevant social data on individual and community knowledge, risk perception and preparedness within their local social networks.
(Note: this resource was added to OER Commons as part of a batch upload of over 2,200 records. If you notice an issue with the quality of the metadata, please let us know by using the 'report' button and we will flag it for consideration.)
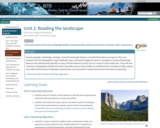
How do geologic, hydrologic, biologic, and built-landscape features manifest themselves on maps? …
How do geologic, hydrologic, biologic, and built-landscape features manifest themselves on maps? In this unit, students will use topographic maps, hillshade maps, and aerial imagery to learn to recognize a variety of landscape features and subsequently identify as many of these features as they can on a map of a new study area. They will also construct a topographic profile from their map data and use their profiles to understand the concepts of slope, aspect, and relief and how these landscape characteristics are important in hazard assessment and land-use planning.
Show more about Online Teaching suggestions Hide Online-adaptable: Part 1 (lecture) and Part 3 (individual or small-group exercise) are particularly straight forward to adapt to online. The landscape scavenger hunt exercise, Part 2, is typically done with printed maps but can be successfully adapted to online by having synchronous groups of students work together to annotate digital map files using: 1) PDF annotation tools in Adobe or 2) putting the map images into a Google Slides file and using the scribble tool. Google Earth files are also provided as an additional option.
(Note: this resource was added to OER Commons as part of a batch upload of over 2,200 records. If you notice an issue with the quality of the metadata, please let us know by using the 'report' button and we will flag it for consideration.)
This unit builds on what students have learned about transform fault hazards …
This unit builds on what students have learned about transform fault hazards to introduce the idea of risk. Students examine earthquake risk along the San Andreas Fault in San Francisco by examining public school sites around the city. Students calculate relative risk (risk = hazard probability x vulnerability x value) due to earthquake hazards at five sites, analyze different seismic hazard scenarios, communicate risks to stakeholders, and evaluate possible responses to seismic hazards. Students conclude with a summative assessment in which they reflect on the value of earthquake forecasts and warnings in mitigating risk.
(Note: this resource was added to OER Commons as part of a batch upload of over 2,200 records. If you notice an issue with the quality of the metadata, please let us know by using the 'report' button and we will flag it for consideration.)
How have average global air temperature and sea level changed in the …
How have average global air temperature and sea level changed in the last three decades? Have the changes been consistent? Can future changes in air temperature and sea level be predicted? In this unit, students will become familiar with the concept of a time series by calculating recent air temperature and sea level trends and projecting these measurements for 2100. They will also begin to consider environmental factors in addition to temperature that could influence sea level and the potential implications of sea level changes during the next century.
Show more about Online Teaching suggestions Hide Online-adaptable: The lecture and main data analysis exercise can easily be moved online. Student discussions are designed to be intermixed into the flow of the lecture and exercise. Thus moving to online discussions would be might take a bit more planning.
(Note: this resource was added to OER Commons as part of a batch upload of over 2,200 records. If you notice an issue with the quality of the metadata, please let us know by using the 'report' button and we will flag it for consideration.)
Students will explore the different aspects of the carbon cycle on Earth. …
Students will explore the different aspects of the carbon cycle on Earth. This includes the original source of all the carbon on our planet, the near ubiquity of carbon, the six principle reservoirs of carbon in the Earth system, and the movement (flux) of carbon between reservoirs. Students will approach the chemical history of carbon by personifying the "journey" of specific carbon atoms throughout geologic time. The unit emphasizes the grand challenges of energy resources and climate change by grounding these issues in a solid understanding of carbon from a systems thinking perspective. The point here is for students to gain a more robust appreciation for the movement of carbon between atmosphere and geosphere, between hydrosphere and biosphere. The unit provides dynamic understanding of how perturbations to one sphere or changes in the amount of carbon in a given reservoir can have implications throughout the Earth system.
(Note: this resource was added to OER Commons as part of a batch upload of over 2,200 records. If you notice an issue with the quality of the metadata, please let us know by using the 'report' button and we will flag it for consideration.)
No restrictions on your remixing, redistributing, or making derivative works. Give credit to the author, as required.
Your remixing, redistributing, or making derivatives works comes with some restrictions, including how it is shared.
Your redistributing comes with some restrictions. Do not remix or make derivative works.
Most restrictive license type. Prohibits most uses, sharing, and any changes.
Copyrighted materials, available under Fair Use and the TEACH Act for US-based educators, or other custom arrangements. Go to the resource provider to see their individual restrictions.