This activity will introduce pH testing of cleaning products, citrus fruits, and …
This activity will introduce pH testing of cleaning products, citrus fruits, and then analyzes a mystery Green product. Students will compare and contrast findings to discover an earth friendly product.
College-level adaptation of a chapter in the Earth Exploration Toolbook. Examine satellite …
College-level adaptation of a chapter in the Earth Exploration Toolbook. Examine satellite images of atmospheric ozone in the Southern Hemisphere to study changes in concentration over a time.
(Note: this resource was added to OER Commons as part of a batch upload of over 2,200 records. If you notice an issue with the quality of the metadata, please let us know by using the 'report' button and we will flag it for consideration.)
This activity covers the causes, effects, and mitigation of urban heat in …
This activity covers the causes, effects, and mitigation of urban heat in New York City. Students use data sets, graphs, maps and images to create their own plan for mitigation in their area. Robust satellite images, city data, tables, maps, and graphs are included in the resource for students to explore.
This informational text explains that while both the Arctic and Antarctica are …
This informational text explains that while both the Arctic and Antarctica are cold, Antarctica is much colder and drier - a polar desert. The text is written at a grades four through five reading level. This version is a full-color PDF that can be printed, cut and folded to form a book. Each book contains color photographs and illustrations.
This informational text explains that while both the Arctic and Antarctica are …
This informational text explains that while both the Arctic and Antarctica are cold, Antarctica is much colder and drier - a polar desert. The text is written at a kindergarten through grade one reading level. This version is a full-color PDF that can be printed, cut and folded to form a book. Each book contains color photographs and illustrations.
This informational text explains that while both the Arctic and Antarctica are …
This informational text explains that while both the Arctic and Antarctica are cold, Antarctica is much colder and drier - a polar desert. The text is written at a grade two through grade three reading level. This is a PDF containing the informational text and a glossary.
This activity by Lauren Roberts guides students through the process of finding, …
This activity by Lauren Roberts guides students through the process of finding, vetting, summarizing, and citing a scientific article. Professor Roberts is from South Mountain Community College in Arizona's Maricopa Community College District.
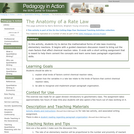
This assignment teaches geochemistry students to explain the mathematical forms of rate …
This assignment teaches geochemistry students to explain the mathematical forms of rate laws, and organize paragraphs in their writing assignments properly.
(Note: this resource was added to OER Commons as part of a batch upload of over 2,200 records. If you notice an issue with the quality of the metadata, please let us know by using the 'report' button and we will flag it for consideration.)
This short film uses graphics to provide an introduction to the physical …
This short film uses graphics to provide an introduction to the physical causes of earthquakes, and to explore how the way we build and manage our cities determines their vulnerability to a seismic strike.
It was created with the UK GCSE and A' Level curricula in mind.
Instructional sequences are more coherent when students investigate compelling natural phenomena (in …
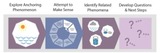
Instructional sequences are more coherent when students investigate compelling natural phenomena (in science) or work on meaningful design problems (in engineering) by engaging in the science and engineering practices. We refer to these phenomena and design problems here as ‘anchors.’Here is a tool to assist in determining if the elements of the anchoring phenomenon are strong or could use some additional thinking. Original works can be found at NextGenStorylines.org
The Anchoring Phenomenon Routine is the launch to student investigation around the …
The Anchoring Phenomenon Routine is the launch to student investigation around the anchoring phenomenon. This phenomenon will be the one that students will describe and explain, using disciplinary core ideas, science and engineering practices and crosscutting concepts in investigations. The Anchoring Phenomenon Routine will encourage thoughtful consideration of the phenomenon, initial models, connections to related phenomenon, discussions about the phenomenon and the creation of the KLEWS chart used for documenting student learning. In an Anchoring Phenomenon Routine, students: ● Are presented with a phenomenon or design problem ● Write and discuss what they notice and wonder about from the initial presentation ● Create and compare initial models of the phenomenon or problem ● Identify related experiences and knowledge that they could draw upon to explain the phenomenon or solve the problem ● Construct a KLEWS Chart ● Identify potential investigations to answer the questions on the KLEWS Chart, adding the questions to the chart
In this activity, students discover the relationship between an object's mass and …
In this activity, students discover the relationship between an object's mass and the amount of space it takes up (its volume). Students learn about the concept of displacement and how an object can float if it displaces enough water, and the concept of density and its relationship to mass and volume.
This short video describes how the compression of Antarctic snow into ice …
This short video describes how the compression of Antarctic snow into ice captures air from past atmospheres. It shows how ice cores are drilled from the Antarctic ice and prepared for shipment and subsequent analysis.
This open course with a new set of ancillary materials for OpenStax …
This open course with a new set of ancillary materials for OpenStax Chemistry was created under a Round Eleven Mini-Grant for Ancillary Materials Creation and Revision. The materials created in order to support faculty implementing OpenStax Psychology in the classroom include:
Lecture Slides Chapter Checklists Practice Problems Newly-Created Videos
Along with these resources, the open course also contains a laboratory section with new instructional videos, a laboratory notebook and a sample notebook with responses, and experiments for each course.
Students prepare for the associated activity in which they investigate acceleration by …
Students prepare for the associated activity in which they investigate acceleration by collecting acceleration vs. time data using the accelerometer of a sliding Android device. Based on the experimental set-up for the activity, students form hypotheses about the acceleration of the device. Students will investigate how the force on the device changes according to Newton's Second Law. Different types of acceleration, including average, instantaneous and constant acceleration, are introduced. Acceleration and force is described mathematically and in terms of processes and applications.
Students investigate the motion of a simple pendulum through direct observation and …
Students investigate the motion of a simple pendulum through direct observation and data collection using Android® devices. First, student groups create pendulums that hang from the classroom ceiling, using Android smartphones or tablets as the bobs, taking advantage of their built-in accelerometers. With the Android devices loaded with the (provided) AccelDataCapture app, groups explore the periodic motion of the pendulums, changing variables (amplitude, mass, length) to see what happens, by visual observation and via the app-generated graphs. Then teams conduct formal experiments to alter one variable while keeping all other parameters constant, performing numerous trials, identifying independent/dependent variables, collecting data and using the simple pendulum equation. Through these experiments, students investigate how pendulums move and the changing forces they experience, better understanding the relationship between a pendulum's motion and its amplitude, length and mass. They analyze the data, either on paper or by importing into a spreadsheet application. As an extension, students may also develop their own algorithms in a provided App Inventor framework in order to automatically note the time of each period.
A student activity to determine the angle of repose and what factors …
A student activity to determine the angle of repose and what factors determine the angle of repose.
(Note: this resource was added to OER Commons as part of a batch upload of over 2,200 records. If you notice an issue with the quality of the metadata, please let us know by using the 'report' button and we will flag it for consideration.)
No restrictions on your remixing, redistributing, or making derivative works. Give credit to the author, as required.
Your remixing, redistributing, or making derivatives works comes with some restrictions, including how it is shared.
Your redistributing comes with some restrictions. Do not remix or make derivative works.
Most restrictive license type. Prohibits most uses, sharing, and any changes.
Copyrighted materials, available under Fair Use and the TEACH Act for US-based educators, or other custom arrangements. Go to the resource provider to see their individual restrictions.