Updating search results...

Search Resources

1221 Results

View
Selected filters:
  • Statistics and Probability
Estimating Exchange Rates of Water in Embayments using Simple Budget Equations.
Conditional Remix & Share Permitted
CC BY-NC-SA
Rating
0.0 stars

Simple budgets may be used to estimate the exchange of water in embayments that capitalize on the concept of steady state and conservation principals. This is especially true for bays that experience a significant exchange of freshwater. This exchange of freshwater may reduce the average salt concentration in the bay compared to seawater if it involves addition of freshwater from rivers, R, and/or precipitation, P. Alternatively, it may increase the average salt concentration in the bay compared to seawater if there is relatively little river input and high evaporation, E. Since freshwater input changes the salt concentration in the bay, and salt is a conservative material, it is possible to combine two steady state budgets for a bay, one for salt and one for water, to solve for the magnitude of the water flows that enter and exit the bay mouth.
Students will make actual calculations for the inflow and outflow of water to Puget Sound, Washington and the Mediterranean Sea and compare them to actual measured values.

(Note: this resource was added to OER Commons as part of a batch upload of over 2,200 records. If you notice an issue with the quality of the metadata, please let us know by using the 'report' button and we will flag it for consideration.)

Subject:
Biology
Chemistry
Geoscience
Life Science
Mathematics
Measurement and Data
Physical Science
Statistics and Probability
Material Type:
Activity/Lab
Provider:
Science Education Resource Center (SERC) at Carleton College
Provider Set:
Teach the Earth
Author:
Keith Sverdrup
Date Added:
11/24/2020
Estimating OUR Carbon Footprint
Conditional Remix & Share Permitted
CC BY-NC-SA
Rating
0.0 stars

Description here.

(Note: this resource was added to OER Commons as part of a batch upload of over 2,200 records. If you notice an issue with the quality of the metadata, please let us know by using the 'report' button and we will flag it for consideration.)

Subject:
Applied Science
Biology
Health, Medicine and Nursing
Life Science
Mathematics
Measurement and Data
Statistics and Probability
Material Type:
Activity/Lab
Provider:
Science Education Resource Center (SERC) at Carleton College
Provider Set:
Teach the Earth
Author:
Ben Galluzzo
Jean McGivney-Burelle
Rikki Wagstrom
Date Added:
05/19/2021
Estimating the Mean State Area
Unrestricted Use
CC BY
Rating
0.0 stars

The task is designed to show that random samples produce distributions of sample means that center at the population mean, and that the variation in the sample means will decrease noticeably as the sample size increases. Random sampling (like mixing names in a hat and drawing out a sample) is not a new idea to most students, although the terminology is likely to be new.

Subject:
Mathematics
Statistics and Probability
Material Type:
Activity/Lab
Provider:
Illustrative Mathematics
Provider Set:
Illustrative Mathematics
Author:
Illustrative Mathematics
Date Added:
05/01/2012
Evaluating Statements About Probability
Only Sharing Permitted
CC BY-NC-ND
Rating
0.0 stars

This lesson unit addresses common misconceptions relating to probability of simple and compound events. The lesson will help you assess how well students understand concepts of: Equally likely events; randomness; and sample sizes.

Subject:
Mathematics
Statistics and Probability
Material Type:
Assessment
Lesson Plan
Provider:
Shell Center for Mathematical Education
Provider Set:
Mathematics Assessment Project (MAP)
Date Added:
04/26/2013
Evaluating the Health of an Urban Wetland Using Electrical Resistivity
Conditional Remix & Share Permitted
CC BY-NC-SA
Rating
0.0 stars

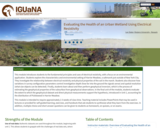
This module introduces students to the fundamental principles and uses of electrical resistivity, with a focus on an environmental application. Students explore the characteristics and environmental setting of Harrier Meadow, a saltmarsh just outside of New York City. They investigate the relationship between electrical resistivity and physical properties of the soil in the marsh. Students also discover how variations in survey configuration parameters control investigation depth (how far into the ground the signals sense) and spatial resolution (what size objects can be detected). Finally, students learn about and then perform geophysical inversion, which is the process of estimating the geophysical properties of the subsurface from geophysical observations. In the final unit of the module, students evaluate the extent to which the geophysical dataset and direct physical measurements support the hypothesis, introduced in Unit 1, accounting for the distribution of Pickleweed in Harrier Meadow.
This module is intended to require approximately 2-3 weeks of class time. Teaching material includes PowerPoints that may be used in lectures or provided for self-guided learning, exercises, and handouts that ask students to synthesize what they learn from the exercises. In addition, multiple choice and short answer questions can be given to students as homework, on quizzes, or on exams.

(Note: this resource was added to OER Commons as part of a batch upload of over 2,200 records. If you notice an issue with the quality of the metadata, please let us know by using the 'report' button and we will flag it for consideration.)

Subject:
Career and Technical Education
Chemistry
Environmental Studies
Hydrology
Mathematics
Measurement and Data
Physical Science
Statistics and Probability
Material Type:
Lesson Plan
Module
Provider:
Science Education Resource Center (SERC) at Carleton College
Provider Set:
Teach the Earth
Author:
Evaluating the Health of an Urban Wetland Using Electrical Resistivity Lee Slater, Rutgers University - Newark [end rawhtml]
Date Added:
09/27/2022
Evolution of Normal Fault Systems During Progressive Deformation
Conditional Remix & Share Permitted
CC BY-NC-SA
Rating
0.0 stars

Many papers by Ken McClay and colleagues have established the value of scale-model experiments in understanding the evolution and geometries of extensional fault systems (e.g. T. Dooley and K.R. McClay, 1997, Analogue modeling of pull-apart basins: American Association of Petroleum Geologists Bulletin, v. 81, no.11, p. 1804 -- 1826).

There are few resources available that help students visualize the dynamic nature of faulting, especially the complex interplay of faults during growth and evolution of a fault system. Such an understanding is critical, however, if students are to think meaningfully about fault geometries and what they imply.

Conducting scale-model experiments in a class setting is useful, but very time-consuming, difficult for all students to see well, and very temporary, except for the end product. Accordingly, taking a cue from a movie produced by Ken McClay, I constructed a deformation apparatus, conducted and filmed several experiments conducted by McClay, and then produced QuickTime movies of the experiments. This approach makes it possible for students to observe an experiment in a minute or two that took 30-45 minutes to produce and to view the experiment repeatedly, so as to become very familiar with all that is taking place.

Individual frames from the movie provide a template on which students can identify the sequence of fault development, rotation of features, and cessation of motion on some faults as they become inactive. Requiring students to document their observations, establish a chronological sequence of events, and explain in writing what happens during the experiment results in an increased awareness of the faulting process.

(Note: this resource was added to OER Commons as part of a batch upload of over 2,200 records. If you notice an issue with the quality of the metadata, please let us know by using the 'report' button and we will flag it for consideration.)

Subject:
Biology
Life Science
Mathematics
Measurement and Data
Statistics and Probability
Material Type:
Activity/Lab
Provider:
Science Education Resource Center (SERC) at Carleton College
Provider Set:
Teach the Earth
Author:
Bob Burger
Date Added:
09/10/2020
Evolution of Tusklessness in African Elephants [version 1.0]
Conditional Remix & Share Permitted
CC BY-SA
Rating
0.0 stars

The exploitation of African elephants in the form of ivory poaching is exacerbated by warfare. The affects of this anthropogenic evolutionary force on the African savanna elephant (Loxodonta africana) in the Gorongoas National Park in Mozambique was investigated (Campbell-Staton, et. al. 2021) after the Mozambican civil war (1997-1992).  This multipart lesson is based on this research.  Here, we explore allele frequencies, phenotypic data, and the use of a chi-squared test to determine if the population is in Hardy-Weinberg Equilibrium.  Because one gene influencing tusklessness is X-linked, we also explore inheritance of the trait, using hemophilia as an example.  The data used in this part of the lesson are simulated data based on reports from Zambia.

Subject:
Mathematics
Statistics and Probability
Material Type:
Activity/Lab
Lecture
Lesson Plan
Reading
Provider:
BioQUEST Curriculum Consortium
Provider Set:
Quantitative Biology at Community Colleges
Date Added:
08/17/2022
Examining Changes in Data - African Americans' Education Levels Through the Years
Unrestricted Use
Public Domain
Rating
0.0 stars

Students will analyze and compare census data on the education levels of African-Americans in 1850 and in 1880. Students will also discuss how historical events can affect data.

Subject:
Mathematics
Statistics and Probability
Material Type:
Activity/Lab
Provider:
U.S. Census Bureau
Provider Set:
Statistics in Schools
Date Added:
10/16/2019
Examining Changes to the Environment Through Pictures and Data
Unrestricted Use
Public Domain
Rating
0.0 stars

Students will examine how human actions and population changes can affect the environment. Students will examine a series of photographs that compare famous landmarks (Times Square, the Saltair Pavilion in Utah, Laguna Beach, and Niagara Falls) across time, and then they will identify human-generated changes in the physical environment, such as the addition of bridges and roads. Students will also examine U.S. Census Bureau population and housing data to see how population changes can contribute to changes in the physical environment. In addition, students will describe the impact of these changes on the environment.

Subject:
Mathematics
Statistics and Probability
Material Type:
Activity/Lab
Provider:
U.S. Census Bureau
Provider Set:
Statistics in Schools
Date Added:
10/18/2019
Excel Templates as a Statistical Tool
Unrestricted Use
CC BY
Rating
0.0 stars

As mentioned in the syllabus, we are using MS Excel for statistical analysis in our OER stats course. We have, therefore, created three templates, one for each of the three units that the course is divided into, in order to help students make necessary calculations. Creating templates was a necessary steps since students are not expected to know how to use Excel functions for statistics and these templates are to guide students into getting relevant stats for their data, such as average, median, histograms, etc. Each template is divided into separate spreadsheets according to the topics. These templates help cut down the tedious work of evaluating statics and help students focus more on the concepts and analyse the results.

Subject:
Statistics and Probability
Material Type:
Teaching/Learning Strategy
Author:
Hersh Patel
Date Added:
01/30/2023
Exercise 8: Using LiDAR and GPS data to model the water table in ArcScene
Conditional Remix & Share Permitted
CC BY-NC-SA
Rating
0.0 stars

In this exercise, students process LiDAR data for the Hamilton College campus area to determine accurate elevations of wellheads of sampling wells on campus. Students use both GPS readings and orthophotos to determine wellhead locations and combine those with water levels, casing heights, and wellhead elevations to interpolate a groundwater surface under the campus and portray the groundwater in ArcScene. They also learn how to use Model Builder. You might also be interested in our Full GIS course with links to all assignments. You might also be interested in our webinar for the NYS GIS Association on A Simple Example of Working with LiDAR using ArcGIS and 3D Analyst.

(Note: this resource was added to OER Commons as part of a batch upload of over 2,200 records. If you notice an issue with the quality of the metadata, please let us know by using the 'report' button and we will flag it for consideration.)

Subject:
Biology
Life Science
Mathematics
Measurement and Data
Statistics and Probability
Material Type:
Activity/Lab
Provider:
Science Education Resource Center (SERC) at Carleton College
Provider Set:
Teach the Earth
Author:
Barb Tewksbury
Date Added:
02/02/2022
Exploiting Polarization: Designing More Effective Sunglasses
Read the Fine Print
Educational Use
Rating
0.0 stars

Students apply what they know about light polarization and attenuation (learned in the associated lesson) to design, build, test, refine and then advertise their prototypes for more effective sunglasses. Presented as a hypothetical design scenario, students act as engineers who are challenged to create improved sunglasses that reduce glare and lower light intensity while increasing eye protection from UVA and UVB radiation compared to an existing model of sunglasses—and make them as inexpensive as possible. They use a light meter to measure and compare light intensities through the commercial sunglasses and their prototype lenses. They consider the project requirements and constraints in their designs. They brainstorm and evaluate possible design ideas. They keep track of materials costs. They create and present advertisements to the class that promote the sunglasses benefits, using collected data to justify their claims. A grading rubric and reflection handout are provided.

Subject:
Applied Science
Engineering
Mathematics
Physical Science
Physics
Statistics and Probability
Material Type:
Activity/Lab
Provider:
TeachEngineering
Provider Set:
Activities
Author:
Adam Alster
Drew Kim
Quan Tran
Date Added:
05/30/2018
Exploring 19th-Century Child Labor Laws in the United States
Unrestricted Use
Public Domain
Rating
0.0 stars

Students will examine historical photographs and a data table related to 19th-century industrialization and child labor. They will observe and analyze the primary sources and ask questions. This activity could be used near the beginning of a unit on industrialization or the Progressives.

Subject:
Mathematics
Statistics and Probability
Material Type:
Activity/Lab
Provider:
U.S. Census Bureau
Provider Set:
Statistics in Schools
Date Added:
10/16/2019
Exploring Diversity with Statistics: Step-by-step JASP Guides
Only Sharing Permitted
CC BY-NC-ND
Rating
0.0 stars

These resources were created to compliment our undergraduate statistics lab manual, Applied Data Analysis in Psychology: Exploring Diversity with Statistics, published by Kendall Hunt publishing company. Like our lab manual, these JASP walk-through guides meaningfully and purposefully integrate and highlight diversity research to teach students how to analyze data in an open-source statistical program. The data sets utilized in these guides are from open-access databases (e.g., Pew Research Center, PLoS One, ICPSR, and more). Guides with step-by-step instructions, including annotated images and examples of how to report findings in APA format, are included for the following statistical tests: independent samples t test, paired samples t test, one-way ANOVA, two factor ANOVA, chi-square test, Pearson correlation, simple regression, and multiple regression.

Subject:
Education
Mathematics
Psychology
Social Science
Statistics and Probability
Material Type:
Activity/Lab
Data Set
Reading
Student Guide
Teaching/Learning Strategy
Provider:
University of Tennessee at Chattanooga
Author:
Ashlyn Moraine
Asia Palmer
Hannah Osborn
Kelsey Humphrey
Kendra Scott
Kristen J. Black
Ruth V. Walker
Date Added:
01/13/2022
Exploring Easter Island Economics with Excel
Conditional Remix & Share Permitted
CC BY-NC-SA
Rating
0.0 stars

Students learn far more from doing than from viewing. By seeing relationships that they have developed themselves, by diagraming those relationships themselves, students learn far more than merely reading over what someone else has done. It is argued that especially for the dynamic problems encountered in environmental and resource economics, Excel has a comparative advantage as a learning aid. We develop a simple, flexible Excel assignment to illustrate the Brander and Taylor (1998) model of the Easter Island economy. Brander and Taylor argue that on Easter Island a crucial natural resource, the island's palm forest, was an open-access (res nullius) resource, leading to over harvesting and eventual societal collapse. Brander and Taylor's simple model showing the interaction of human population with a renewable resource, a forest, mimics what is known about the human population and forest from archaeological evidence.

The open access institutional protection of renewable resources is illustrated by a simple diagram of population and resource stock over centuries, a model much like ordinary predator-prey models in biology. Variations on the basic Brander and Taylor model, such as changes in propoerty rights institutions and/or changes in technology, based on published work in the literature, can be explored and compared to the original Brander and Taylor results of boom and eventual collapse.

Brander, J.A. and M.S. Taylor (1998). The simple economics of Easter Island: A Ricardo -- Malthus model of renewable resource use. American Economic Review

(Note: this resource was added to OER Commons as part of a batch upload of over 2,200 records. If you notice an issue with the quality of the metadata, please let us know by using the 'report' button and we will flag it for consideration.)

Subject:
Biology
Career and Technical Education
Economics
Environmental Studies
Life Science
Mathematics
Measurement and Data
Social Science
Statistics and Probability
Material Type:
Activity/Lab
Provider:
Science Education Resource Center (SERC) at Carleton College
Provider Set:
Teach the Earth
Author:
Morris Coats
Date Added:
11/04/2021
Exploring Marine Primary Productivity with Descriptive Statistics and Graphing in Excel [version 1.0]
Conditional Remix & Share Permitted
CC BY-SA
Rating
0.0 stars

In this activity, students use real water chemistry data and descriptive statistics in Excel to examine primary productivity in an urban estuary of the Salish Sea. They will consider how actual data do or do not support expected annual trends.

Subject:
Ecology
Life Science
Mathematics
Measurement and Data
Statistics and Probability
Material Type:
Data Set
Lesson Plan
Provider:
BioQUEST Curriculum Consortium
Provider Set:
Quantitative Biology at Community Colleges
Date Added:
01/29/2023
Exploring Marine Primary Productivity with Descriptive Statistics and Graphing in Excel [version 1.0]
Conditional Remix & Share Permitted
CC BY-SA
Rating
0.0 stars

In this activity, students use real water chemistry data and descriptive statistics in Excel to examine primary productivity in an urban estuary of the Salish Sea. They will consider how actual data do or do not support expected annual trends.

Subject:
Ecology
Life Science
Mathematics
Measurement and Data
Statistics and Probability
Material Type:
Data Set
Lesson Plan
Provider:
BioQUEST Curriculum Consortium
Provider Set:
Quantitative Biology at Community Colleges
Date Added:
09/02/2021
Exploring Personal Footprints
Conditional Remix & Share Permitted
CC BY-NC-SA
Rating
0.0 stars

Students apply the main research methods in sociology to explore their personal footprints (i.e., the global consequences of their individual actions).

(Note: this resource was added to OER Commons as part of a batch upload of over 2,200 records. If you notice an issue with the quality of the metadata, please let us know by using the 'report' button and we will flag it for consideration.)

Subject:
Biology
Career and Technical Education
Environmental Studies
Life Science
Mathematics
Measurement and Data
Social Science
Sociology
Statistics and Probability
Material Type:
Activity/Lab
Provider:
Science Education Resource Center (SERC) at Carleton College
Provider Set:
Teach the Earth
Author:
Bev Farb, Everett Community College
Date Added:
04/09/2018
Exploring Radiometric Dating with Dice
Conditional Remix & Share Permitted
CC BY-NC-SA
Rating
0.0 stars

An activity in which students use dice to explore radioactive decay and dating and make simple calculations.

(Note: this resource was added to OER Commons as part of a batch upload of over 2,200 records. If you notice an issue with the quality of the metadata, please let us know by using the 'report' button and we will flag it for consideration.)

Subject:
Biology
Geoscience
Life Science
Mathematics
Measurement and Data
Physical Science
Statistics and Probability
Material Type:
Activity/Lab
Simulation
Provider:
Science Education Resource Center (SERC) at Carleton College
Provider Set:
Teach the Earth
Author:
Carla Whittington derived from Baer (1999) Related Links Radioactive Decay ProbabilityExponential Growth and Decay
Date Added:
08/25/2019