How can an understanding of pH—a logarithmic scale used to identify the …
How can an understanding of pH—a logarithmic scale used to identify the acidity or basicity of a water-based solution—be used to design and create a color-changing paint? This activity provides students the opportunity to extract dyes from natural products and test dyes for acids or bases as teams develop a prototype “paint” that is eventually applied to help with a wall redesign at a local children’s hospital. Students learn about how dyes are extracted from organic material and use the engineering design process to test dyes using a variety of indicators to achieve the right color for their prototype. Students iterate on their dyes and use ratios and proportions to calculate the amount of dye needed to successfully complete their painting project.
The Challenge Question of the Legacy Cycle draws the student into considering …
The Challenge Question of the Legacy Cycle draws the student into considering the engineering ingenuity of nature. It will force him to analyze, appreciate and understand the wisdom of these designs as the student team focuses on meeting each of the challenge's requirements. The student is asked, with his team members, to envision a sustainable design for a future guest village within the Saguaro National Park, outside of Tucson, Arizona. What issues need to be addressed to support the comforts of park visitors without compromising the natural resources or endangering the endemic species of the area? A deeper scope of application will reveal extensions of this design in the incorporation of urban planning and systems design. It also strengthens the concept of manufacturing and building without producing waste or pollution.
This course covers the complete cycle of designing an ocean system using …
This course covers the complete cycle of designing an ocean system using computational design tools for the conceptual and preliminary design stages. Students complete the projects in teams with each student responsible for a specific subsystem. Lectures cover such topics as hydrodynamics; structures; power and thermal aspects of ocean vehicles; environment, materials, and construction for ocean use; and generation and evaluation of design alternatives. The course focuses on innovative design concepts chosen from high-speed ships, submersibles, autonomous vehicles, and floating and submerged deep-water offshore platforms. Lectures on ethics in engineering practice are included, and instruction and practice in oral and written communication is provided.
Project lesson plan involving detecting floating marine debris. Connections to the oceans' …
Project lesson plan involving detecting floating marine debris. Connections to the oceans' garbage patches. Resource using Micro:bit and extension equipment to wire devices and Microsoft Makecode to code the Micro:bit to perform processes. Engineering Design Process is used to design a floating platform to hold and protect all equipment from water while it performs its functions.
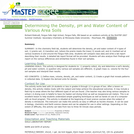
Students use two different methods to determine the densities of a variety …
Students use two different methods to determine the densities of a variety of materials and objects. The first method involves direct measurement of the volumes of objects that have simple geometric shapes. The second is the water displacement method, used to determine the volumes of irregularly shaped objects. After the densities are determined, students create x-y scatter graphs of mass versus volume, which reveal that objects with densities less than water (floaters) lie above the graph's diagonal (representing the density of water), and those with densities greater than water (sinkers) lie below the diagonal.
In this problem-based learning (PBL) activity, students take on the role of …
In this problem-based learning (PBL) activity, students take on the role of a student research scientist and explore the role of solar energy in determining climate, focusing on the urban heat island effect. Students conduct research and compare temperatures between two cities, and determine the factors that are responsible for the difference exhibited between them. The lesson is supported by teacher notes, answer key, glossary and an appendix with information about using PBL in the classroom. This is the third of three activities in Investigating the Climate System: Energy, a Balancing Act, and serves as an authentic assessment for all three modules.
For nearly 100 years, the site that is now High Cliff State …
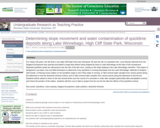
For nearly 100 years, the site that is now High Cliff State Park near Sherwood, WI was the site of a quicklime kiln. Local Silurian dolomite from the Niagara Escarpment was quarried and baked in large kilns before being shipped by boat on Lake Winnebago at the base of the escarpment. Rejected quicklime spoils are still present near the site of the kiln ruins, resting on the slope leading to the Lake Winnebago shoreline. This project is designed to use basic, low-cost field techniques to determine if any quicklime is moving downslope and into Lake Winnebago. Methods of analysis will include: 1) Placing survey stakes on the quicklime slope to see if they slope is moving, 2) Take several water samples from various points along the lakeshore to test the dissolved mineral content, and 3) Take several water samples from various points along the lakeshore to test the pH. Students will be asked to return to the site several times over the course of a semester in order take samples (particularly after precipitation events) and check the position of the stakes. Students will then use to data to project how far out into the lake the effects of the quicklime extend.
Key words: Quicklime, mass wasting, Niagara Escarpment, water pollution, dissolved minerals
(Note: this resource was added to OER Commons as part of a batch upload of over 2,200 records. If you notice an issue with the quality of the metadata, please let us know by using the 'report' button and we will flag it for consideration.)
In this activity the students calculate recurrence intervals for some historical crests …
In this activity the students calculate recurrence intervals for some historical crests on the Chippewa River and identify the 100-year flood plain in downtown Eau Claire. The students also evaluate the effect of a 20ft high stage event along the whole Chippewa River with the goal of showing how topography influences the size of the area affected by flooding events. The students also evaluate the effectiveness of a flood gate system located on campus.
(Note: this resource was added to OER Commons as part of a batch upload of over 2,200 records. If you notice an issue with the quality of the metadata, please let us know by using the 'report' button and we will flag it for consideration.)
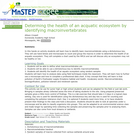
In this field lab activity, students will determine the density, pH and …
In this field lab activity, students will determine the density, pH and water content of prairie soil, transition soil, woods soil, and riverbed soil and compare their findings.
This activity is a two-part (three week) lab in which students initially …
This activity is a two-part (three week) lab in which students initially develop a claim (non-scientific) and learn how to use evidence to support a claim. They then are provided with a scientific research question for which they need to make a claim supported with evidence from their own models (river/stream tables). Based on their results, they then ask a new research question, design the model, carry out their tests and report their results.
(Note: this resource was added to OER Commons as part of a batch upload of over 2,200 records. If you notice an issue with the quality of the metadata, please let us know by using the 'report' button and we will flag it for consideration.)
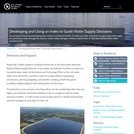
It's not easy to keep faucets flowing year-round in southwest Florida. To …
It's not easy to keep faucets flowing year-round in southwest Florida. To make sure their customers can get ample clean water at a good priceeven through dry seasonswater utility managers crafted a useful index to help them decide which water sources to use.
Microbiology is the study of microorganisms, which are tiny organisms that can …
Microbiology is the study of microorganisms, which are tiny organisms that can only be seen with a microscope. Microorganisms include bacteria, viruses, fungi, and protozoa. Microorganisms are found everywhere in the environment, including in water, soil, air, and in the bodies of plants and animals. Microbiology is an important science that helps us to understand how microorganisms interact with each other and with their environment. Microbiology also helps us to understand how microorganisms can cause disease and how they can be used to produce food and medicines. Teaching microbiology can be a fun and interesting experience for students. There are many different ways to teach microbiology, and the best way to teach it will depend on the students’ age and level of education. One way to teach microbiology is to use learning materials that are specifically designed for schools. These materials can help to make the learning process more fun and interesting for students. Some of the best practices for developing microbiology learning materials for schools include: 1. Developing materials that are age-appropriate 2. Using fun and interactive activities 3. Incorporating images and videos 4. Using real-world examples 5. Including assessment questions
Why are some countries rich and others poor? This fundamental question has …
Why are some countries rich and others poor? This fundamental question has been on the mind of economists since Adam Smith wrote "The Wealth of Nations" in 1776. This is a full course that covers all the major issues and developments in the field of development economics. Unlike typical college courses, we will take you to the frontier of the discipline, covering recent research as well as more established material. This course is non-technical and is accessible to a beginner. If you pass the final exam, you will earn our "Development Economics" certificate on your profile.
We introduced a new required course "EnSc 210: Issues in Environmental Science" …
We introduced a new required course "EnSc 210: Issues in Environmental Science" for our majors about three years ago. When I was assigned to teach this course for the first time, I struggled with developing a syllabus and recommending a text for the course. Since we also offer classes in "Environmental Geology" and an introductory course "EnSc 110 Understanding the Earth," the challenge was to avoid duplication while developing an appropriate syllabus. What I finally decided to do was to have students provide ideas. So, on the first day of class I announced that we don't have a syllabus for this course (many sighs of disappointment) and, after a brief remark on some current environmental issues, invited each student to suggest at least one topic for inclusion in the course. After some hesitation (as expected) hands went up and I began writing each topic on the white board. Pretty soon we had 20-25 topics with some overlapping themes. Some of these included: population problem, global climate change, air and water pollution, waste management, environmental health, species decline, environmental impact of large dams, and sustainability. After some discussions about relative importance of various topics and the time available to cover each during the semester, we narrowed it down to about 10 topics for detailed study. I prepared my syllabus (linked below) based on this list which worked very well because: we were able to include key topics and, very importantly, students felt a sense of 'ownership' which led to a very interesting and interactive class experience throughout the semester.
(Note: this resource was added to OER Commons as part of a batch upload of over 2,200 records. If you notice an issue with the quality of the metadata, please let us know by using the 'report' button and we will flag it for consideration.)
Determine the dew point temperature for your classroom through a hands-on experiment. …
Determine the dew point temperature for your classroom through a hands-on experiment. Use humidity and temperature probes to investigate the temperature at which it would rain in your classroom! Learn about water density and the conditions necessary to produce fog or rain.
Landslide between Highway 7 and the Susquehanna River (42.4947º N, 74.98212º W). …
Landslide between Highway 7 and the Susquehanna River (42.4947º N, 74.98212º W). Although, this exercise may be adapted elsewhere. An active, large active hillslope is required, preferably one close to infrastructure, and one which students can access safely. The following features are not uncommon, and make the problem richer: a river bend at the toe of the hillslope; a gas or water line routed through the slide; a hillslope exhibiting numerous scales of movements, from small debris flows a few cm wide to large rotational slides; and nearby infrastructure, such as buildings or roads.
(Note: this resource was added to OER Commons as part of a batch upload of over 2,200 records. If you notice an issue with the quality of the metadata, please let us know by using the 'report' button and we will flag it for consideration.)
Learners will use trays of sand and cups of water to recreate …
Learners will use trays of sand and cups of water to recreate surface features seen in images of Mars. This is activity 5 of 9 in Mars and Earth: Science Learning Activities for After School.
Some of the Viking images sent back from Mars in the 1970s …
Some of the Viking images sent back from Mars in the 1970s show tantalizing evidence of dendritic valley networks in some of the oldest terrains on the planet. One of the big questions ever since has been whether it might have rained early in Mars history.
One of the ways of deciding whether the Mars valley networks might have been produced by rainfall is to find out how similar they are to valley networks on Earth, which we know are produced by rainfall. The standard method for analyzing drainage basins is comparison of the number of drainage segments per square kilometer (drainage density) and how extensively branched the network is (stream order).
In this exercise, students calculate stream order for valley segments mapped by Hynek and Phillips (2003) using MOC/MOLA data. Students then use data on valley segment length and drainage basin area from Hynek and Phillips (2003) to calculate drainage density. They compare stream order and drainage density for the Mars site with similar calculations for areas on Earth and evaluate the question of whether valley networks on Mars might be consistent with rainfall on an early Mars, and what the uncertainties and limitations are in their conclusions.
(Note: this resource was added to OER Commons as part of a batch upload of over 2,200 records. If you notice an issue with the quality of the metadata, please let us know by using the 'report' button and we will flag it for consideration.)
During this lab, students determine the salinity of collected water samples. They …
During this lab, students determine the salinity of collected water samples. They also compare the effect of the solute concentration of their samples with that of solutions of known solute concentrations on plant cells.
No restrictions on your remixing, redistributing, or making derivative works. Give credit to the author, as required.
Your remixing, redistributing, or making derivatives works comes with some restrictions, including how it is shared.
Your redistributing comes with some restrictions. Do not remix or make derivative works.
Most restrictive license type. Prohibits most uses, sharing, and any changes.
Copyrighted materials, available under Fair Use and the TEACH Act for US-based educators, or other custom arrangements. Go to the resource provider to see their individual restrictions.