In this laboratory exercise students will have an opportunity to examine the …
In this laboratory exercise students will have an opportunity to examine the crystal structures, optical properties and health hazards of the common asbestos minerals. The laboratory will reinforce optical microscopic skills that students have learned in mineralogy and show them how mineralogy can be critical to understanding a current public policy issue.
(Note: this resource was added to OER Commons as part of a batch upload of over 2,200 records. If you notice an issue with the quality of the metadata, please let us know by using the 'report' button and we will flag it for consideration.)
Based out of Washington State University, Dr. Universe teams up with professors, …
Based out of Washington State University, Dr. Universe teams up with professors, researchers, and experts in the field, to tackle big questions. Explore animated video answers to questions posed by curious questions from students in Washington and around the world. Videos created in partnership with Northwest Public Broadcasting. Though not openly licensed, content is free to view online and listen to via podcast.
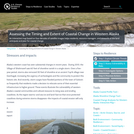
Assemble a regional geologic history by compiling observations made a several sites. …
Assemble a regional geologic history by compiling observations made a several sites.
(Note: this resource was added to OER Commons as part of a batch upload of over 2,200 records. If you notice an issue with the quality of the metadata, please let us know by using the 'report' button and we will flag it for consideration.)
This activity has students determine the angle of subduction using GeoMapApp. Students …
This activity has students determine the angle of subduction using GeoMapApp. Students use datasets available within GeoMapApp to examine the influence of the age of oceanic lithosphere and convergence rate on the angle of subduction. These datasets include: earthquakes (depth, magnitude, etc), subduction interface (based on earthquake data), convergence rate, and age of oceanic lithosphere.
(Note: this resource was added to OER Commons as part of a batch upload of over 2,200 records. If you notice an issue with the quality of the metadata, please let us know by using the 'report' button and we will flag it for consideration.)
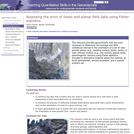
Using Landsat 8 imagery from before and after the 2015 wildfire season …
Using Landsat 8 imagery from before and after the 2015 wildfire season in Glacier National Park, Montana, learners calculate the damage using a Normalized Burn Index, digitize the burn area, and publish to ArcGIS Online.
Stakeholders of the Morro Bay National Estuary Program in California worked with …
Stakeholders of the Morro Bay National Estuary Program in California worked with resources from the EPA's Climate Ready Estuaries program to identify their climate risks. Their results helped them prioritize actions for building resilience.
This easy-to-understand video animation describes drought and explains the different categories of …
This easy-to-understand video animation describes drought and explains the different categories of drought used by the drought monitor. It discusses the effects of and contributions to drought, what the implications of the different drought levels are, and puts the drought maps into context to understand how the impacts vary geographically (e.g. drought in Nevada vs Kansas - one could affect tourism, the other agriculture). It also touches on how the development of maps/drought severity is determined and how it might vary geographically. The animation provides a basic overview of statistics and percentiles and the concept of '100 year events.'
Students will read primary scientific literature, work collaboratively, think critically, and utilize …
Students will read primary scientific literature, work collaboratively, think critically, and utilize GIS as a tool to visualize and quantify spatial and temporal changes in hydrological systems.
(Note: this resource was added to OER Commons as part of a batch upload of over 2,200 records. If you notice an issue with the quality of the metadata, please let us know by using the 'report' button and we will flag it for consideration.)
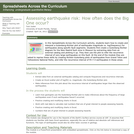
An exercise assessing the water demand of New York City and population …
An exercise assessing the water demand of New York City and population dynamics underlying that demand is provided. Visualization of first order water resource estimates using precipitation data and a known water storage volume are used to draw conclusions about drought risk and the sustainability of NYC water supplies.
(Note: this resource was added to OER Commons as part of a batch upload of over 2,200 records. If you notice an issue with the quality of the metadata, please let us know by using the 'report' button and we will flag it for consideration.)
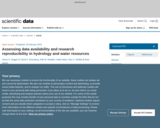
There is broad interest to improve the reproducibility of published research. We …
There is broad interest to improve the reproducibility of published research. We developed a survey tool to assess the availability of digital research artifacts published alongside peer-reviewed journal articles (e.g. data, models, code, directions for use) and reproducibility of article results. We used the tool to assess 360 of the 1,989 articles published by six hydrology and water resources journals in 2017. Like studies from other fields, we reproduced results for only a small fraction of articles (1.6% of tested articles) using their available artifacts. We estimated, with 95% confidence, that results might be reproduced for only 0.6% to 6.8% of all 1,989 articles. Unlike prior studies, the survey tool identified key bottlenecks to making work more reproducible. Bottlenecks include: only some digital artifacts available (44% of articles), no directions (89%), or all artifacts available but results not reproducible (5%). The tool (or extensions) can help authors, journals, funders, and institutions to self-assess manuscripts, provide feedback to improve reproducibility, and recognize and reward reproducible articles as examples for others.
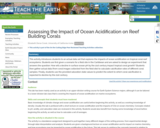
This activity introduces students to an actual data set that explores the …
This activity introduces students to an actual data set that explores the impacts of ocean acidification on tropical coral reef ecosystems. Students are first given a scenario for a field site in the Caribbean and are asked to design an experiment that answers the question: How will a decline in surface ocean pH by the 21st century impact tropical coral growth? Students then gather actual data (from coral images collected from the field site) to calculate calcification rates of different coral samples. Finally, students use the provided saturation state values to predict the extent to which coral calcification is expected to decline by the 21st century.
Finding themselves in the middle of the Amazon rainforest after a plane …
Finding themselves in the middle of the Amazon rainforest after a plane crash, students use map scales, keys, and longitude and latitude coordinates to figure out where they are. Then they work in groups to generate ideas and make plans. They decide where they should go to be rescued, the distance to that location, the route to take, and make calculations to estimate walking travel time.
An interactive map based on four decades of satellite images helps residents, …
An interactive map based on four decades of satellite images helps residents, resource managers, and stewards of the land anticipate and plan for coastal change.
Instruction on use of Fisher statistics to determine the mean and 95% …
Instruction on use of Fisher statistics to determine the mean and 95% confidence interval of geological vectors, lines or planes, with examples, problems and an Excel spreadsheet for computation.
(Note: this resource was added to OER Commons as part of a batch upload of over 2,200 records. If you notice an issue with the quality of the metadata, please let us know by using the 'report' button and we will flag it for consideration.)
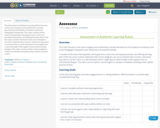
The Assessment of Authentic Learning Rubric focuses on the areas of agency …
The Assessment of Authentic Learning Rubric focuses on the areas of agency and authenticity, concepts derived from the Student as Producer and Social Pedagogies frameworks. The rubric consists of five areas: learning tasks, learning process, social core, learning assessments, and lifelong learning. Each of the five areas contains statements that course designers can use to evaluate their course/s. Instructors may elect to use the rubric as a self-evaluation tool or might elect to work through it with support from an instructional designer. The rubric can be used for course taught in a variety of modalities including online, hybrid, and face-to-face.
In this homework assignment students are asked to consider the balance of …
In this homework assignment students are asked to consider the balance of forces on a hill slope using the Factor of Safety.
(Note: this resource was added to OER Commons as part of a batch upload of over 2,200 records. If you notice an issue with the quality of the metadata, please let us know by using the 'report' button and we will flag it for consideration.)
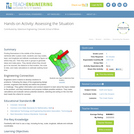
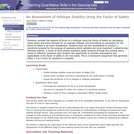
This project helps familiarize students with data commonly available from well drillers, …
This project helps familiarize students with data commonly available from well drillers, the Department of Natural Resources and Conservation, and the Montana Bureau of Mines and Geology. Such data is often used to produce consulting reports. In this exercise, students practice working with available data and writing a consulting report while working on a real project of local interest. The question involves the probability of success in drilling a large well for a new county park. Students are given various maps and are guided through the use of a statewide database that contains well logs and well data. The outcome is a written report that describes the location and general geology of the site, uses the available data to summarize the types of materials that a driller might encounter, answers the questions that the client is interested in, and identifies problems or advantages presented by the groundwater system as indicated by available data.
(Note: this resource was added to OER Commons as part of a batch upload of over 2,200 records. If you notice an issue with the quality of the metadata, please let us know by using the 'report' button and we will flag it for consideration.)
First assignment of the course (Note: this resource was added to OER …
First assignment of the course
(Note: this resource was added to OER Commons as part of a batch upload of over 2,200 records. If you notice an issue with the quality of the metadata, please let us know by using the 'report' button and we will flag it for consideration.)
No restrictions on your remixing, redistributing, or making derivative works. Give credit to the author, as required.
Your remixing, redistributing, or making derivatives works comes with some restrictions, including how it is shared.
Your redistributing comes with some restrictions. Do not remix or make derivative works.
Most restrictive license type. Prohibits most uses, sharing, and any changes.
Copyrighted materials, available under Fair Use and the TEACH Act for US-based educators, or other custom arrangements. Go to the resource provider to see their individual restrictions.