Today's math curriculum is teaching students to expect -- and excel at …
Today's math curriculum is teaching students to expect -- and excel at -- paint-by-numbers classwork, robbing kids of a skill more important than solving problems: formulating them. In his talk, Dan Meyer shows classroom-tested math exercises that prompt students to stop and think. (Filmed at TEDxNYED.)
Learn how instructional designers use data to inform the creation of a …
Learn how instructional designers use data to inform the creation of a Learning Persona. Learning Personas help determine the needs of the training and help ...
This page shares five units of youcubed lessons for grades 6-10 that …
This page shares five units of youcubed lessons for grades 6-10 that introduce students (and teachers) to data science. The units start with an introduction to the concept of data and move to lessons that invite students to explore their own data sets. These lessons teach important content through a pattern-seeking, exploratory approach, and are designed to engage students actively.
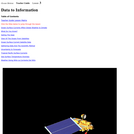
Data Science LessonsThis page shares five units of youcubed lessons for grades 6-10 that introduce students (and teachers) to data science. The units start with an introduction to the concept of data and move to lessons that invite students to explore their own data sets. These lessons teach important content through a pattern-seeking, exploratory approach, and are designed to engage students actively. The culminating unit is a citizen science project that gives students an opportunity to conduct a data inquiry. The lessons accompany a new online course for teachers, where some of the lessons are featured, along with other lesson ideas. These lessons are offered with ideas for in-person or online teaching, and can be taught at any time of year.
LessonsTeacher Online Course: 21st Century Teaching and LearningUnit 1: Data Is EverywhereUnit 2: Working With Data Analysis ToolsUnit 3: Measures of Center & SpreadUnit 4: Understanding VariabilityUnit 5: A Community Data Collection Project
ResourcesHigh School Data Science CourseCODAPWhat's Going On In This Graph?Data Science Initiative VideoThe Data Science K-12 MovementData Talks
The goal of the Data4Kids project is to help educators prepare children …
The goal of the Data4Kids project is to help educators prepare children to be better data users, stewards, and consumers. With support from the South Big Data Hub, the Urban Institute and its partners have created a set of tools and resources to help teach kids in primary and secondary schools about data, data science, and data visualization in a virtual environment.
These "Data Stories" are designed to assist educators in supporting students’ data science learning, and can be allow educators to freely used across a variety of grades. Each story is a starter kit for educators at different levels–grades 3-5 (Band 1); grades 6-8 (Band 2); or grades 9-12 (Band 3).
Each Data Story includes an Instructor's Guide, Data (available in Microsoft Excel, CSV, and Google Sheets formats), a Data Dictionary to describe the data values in each story (available in Microsoft Word and Google Doc formats), and Teaching Slides (available in Microsoft PowerPoint and Google Slides formats).
Data talks are short 5-10 minute classroom discussions to help students develop …
Data talks are short 5-10 minute classroom discussions to help students develop data literacy. This pedagogical strategy is similar in structure to a number talk, but instead of numbers students are shown a data visual and asked what interests them.
This lesson incorporates sea surface data collected by NASA satellites. Data for …
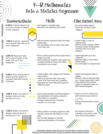
This lesson incorporates sea surface data collected by NASA satellites. Data for three surface characteristics- height, temperature and speed- are used for several activities. Students examine the differences in speed of currents relative to distance from the Equator. Sea surface data anomalies are charted and further analyzed. In addition, surface current data is presented to examine patterns related to El Niño. Note that this is lesson three of five on the Ocean Motion website. Each lesson investigates ocean surface circulation using satellite and model data and can be done independently. See Related URL's for links to the Ocean Motion Website that provide science background information, data resources, teacher material, student guides and a lesson matrix.
This lesson unit is intended to help teachers assess how well students …
This lesson unit is intended to help teachers assess how well students are able to use linear inequalities to create a set of solutions. In particular, the lesson will help teachers identify and assist students who have difficulties in: representing a constraint by shading the correct side of the inequality line; and understanding how combining inequalities affects a solution space.
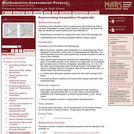
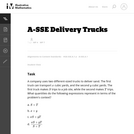
The primary purpose of this task is to illustrate certain aspects of …
The primary purpose of this task is to illustrate certain aspects of the mathematics described in the A.SSE.1. The task has students look for structure in algebraic expressions related to a context, and asks them to relate that structure to the context. In particular, it is worth emphasizing that the task requires no algebraic manipulation from the students.
In this visualization adapted from the University of Massachusetts Medical School, discover …
In this visualization adapted from the University of Massachusetts Medical School, discover the role that dengue viral proteins play in a human cell as the virus prepares to replicate.
No restrictions on your remixing, redistributing, or making derivative works. Give credit to the author, as required.
Your remixing, redistributing, or making derivatives works comes with some restrictions, including how it is shared.
Your redistributing comes with some restrictions. Do not remix or make derivative works.
Most restrictive license type. Prohibits most uses, sharing, and any changes.
Copyrighted materials, available under Fair Use and the TEACH Act for US-based educators, or other custom arrangements. Go to the resource provider to see their individual restrictions.