Students use an EPA data set of Nevada mines to evaluate proximity …
Students use an EPA data set of Nevada mines to evaluate proximity of mine sites to streams to choose priority water sampling sites to evaluate for possible contamination. Students export data to Google Earth to use satellite imagery to narrow the priority sites further. You might also be interested in our Full GIS course with links to all assignments.
(Note: this resource was added to OER Commons as part of a batch upload of over 2,200 records. If you notice an issue with the quality of the metadata, please let us know by using the 'report' button and we will flag it for consideration.)
The following lab will introduce students to the basic concepts of seismic …
The following lab will introduce students to the basic concepts of seismic refraction as well as some actual data collected during seismic refraction surveys. You will use your knowledge of seismic refraction to calculate various parameters of interest. The two travel time data sets come from an existing SERC activity by Robert Cicerone at Bridgewater State College.
(Note: this resource was added to OER Commons as part of a batch upload of over 2,200 records. If you notice an issue with the quality of the metadata, please let us know by using the 'report' button and we will flag it for consideration.)
Ensembl runs API workshops worldwide, and here we have made one available …
Ensembl runs API workshops worldwide, and here we have made one available online. You will find a collection of video lectures from the 'Ensembl API workshop' that took place at EMBL-EBI 22nd-24th May 2013, using Ensembl version 71. The exercises associated with the workshop are included to carry out at your leisure.
By the end of the course you will be able to: Describe how data are organised in the Ensembl database Describe how Ensembl assigns objects and methods Navigate the API Doxygen documentation Write Perl scripts that query the Ensembl database for various different kinds of data
This exercise uses empirical data and Google Earth to explore the surficial …
This exercise uses empirical data and Google Earth to explore the surficial distribution of marine sediments in the modern ocean. Over 2500 sites are plotted with access to original data. We recommend first completing the Primer on Google Earth to become familiar with tools in Google Earth that are used in this exercise. The Exploring Marine Sediments in Google Earth exercise has four parts:
- Stories from the Sea Floor: A Lesson on How Science Works - A First Look at Marine Sediments - Exploring the Distribution of Marine Sediment Types on the Sea Floor - Refining Your Hypotheses on Biogenic Marine Sediment Distributions
This is the second module in our training series that will provide …
This is the second module in our training series that will provide participants with an introduction to OER evaluation tools. We have designed these modules to first spark the learner's interest in the topics covered and then dig deeper into the content through presentations, storytelling, and demonstrations of the tools. We will offer opportunities for learners to practice exploring the resources and tools, and reflect on how they might use them in their work.
In this lesson, students use data to analyze the participation of white, …
In this lesson, students use data to analyze the participation of white, black, Asian and Hispanic men and women in STEM careers as compared with their participation in the general workforce. They then discuss the possible reasons identity groups are unequally represented in STEM careers.
The goal of these class activities is to help students interpret maps …
The goal of these class activities is to help students interpret maps and associated data. The first activity highlights underinvestment in disadvantaged communities across the United States. The second activity explores women’s rights and inequality from a global perspective.
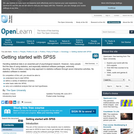
Handling statistical data is an essential part of psychological research. However, many …
Handling statistical data is an essential part of psychological research. However, many people find the idea of using statistics, and especially statistical software packages, extremely daunting. This unit takes a step-by-step approach to statistics softw
Building on what they learned about wired and wireless electrical connections in …
Building on what they learned about wired and wireless electrical connections in the associated lesson, students use Android phones to take advantage of Bluetooth wireless connections to remotely guide LEGO MINDSTORMS(TM) NXT robots through a maze. They compare this wireless remote control navigation to their previous experiences navigating LEGO robots via programming. A PowerPoint® presentation and pre/post quizzes are provided.
Students are given a difficult challenge that requires they integrate what they …
Students are given a difficult challenge that requires they integrate what they have learned so far in the unit about wait blocks, loops and switches. They incorporate these tools into their programming of the LEGO MINDSTORMS(TM) NXT robots to perform different tasks depending on input from a sound sensor and two touch sensors. This activity helps students understand how similar logic is implemented for other every day device operations via computer programs. A PowerPoint® presentation, pre/post quizzes and worksheet are provided.
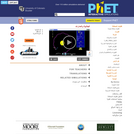
Move the sun, earth, moon and space station to see how it …
Move the sun, earth, moon and space station to see how it affects their gravitational forces and orbital paths. Visualize the sizes and distances between different heavenly bodies, and turn off gravity to see what would happen without it!
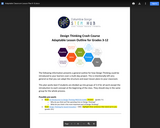
This is a highly adaptable outline for how design thinking could be …
This is a highly adaptable outline for how design thinking could be introduced to your learners over a multi-day project. This plan works best if students are divided up into groups of 3-4 for all work except the introduction to each concept at the beginning of class. Learners should stay in the same group for the whole class.
Includes pre-work links, general instructions to guide planning for each day, design thinking student handouts, and multi-grade NGSS standards linked to design thinking.
Using a computer interactive tool, students investigate the changes in coastline that …
Using a computer interactive tool, students investigate the changes in coastline that would result from a change in sea level, and suggest what factors could cause a rise in sea level. The activity asks students to reflect on outcomes of their investigations completed during the Ice Ages and Night Life activities, all of which are part of Space Update, a collection of resources and activities provided to teach about Earth and space. Summary background information, data and images supporting the activity are available on the Earth Update data site. To complete the activity, students will need to access the Space Update multimedia collection, which is available for download and purchase for use in the classroom.
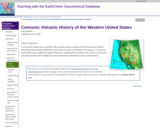
In this activity, students view a Quicktime video animation based on data …
In this activity, students view a Quicktime video animation based on data from the North American Volcanic and Intrusive Rock Database (NAVDAT) to learn about the history of volcanism in the western U.S. during the last 65 million years. Students are guided through the complex data-rich animation with a series of instructions and study questions which highlight time-space-composition relationships and link to plate tectonics.
(Note: this resource was added to OER Commons as part of a batch upload of over 2,200 records. If you notice an issue with the quality of the metadata, please let us know by using the 'report' button and we will flag it for consideration.)
students are engaged in reflecting on whether plate tectonics is a general …
students are engaged in reflecting on whether plate tectonics is a general theory of planetary organization and evolution. Students use topographic, magnetic, spectral, and other data from NASA and ESA missions to determine whether "Earth-style" plate tectonics is functional on planets and moons elsewhere in the solar system. Students are engaged in a data-rich environment from which they must formulate and test multiple hypotheses. Throughout the process, students are engaged in small groups to identify what they need to learn to answer their questions, what resources are available to them, how best to report their findings, and how they can assess the amount of learning that is taking place.
In this deep dive session, we introduce the basics of pre-registration: a …
In this deep dive session, we introduce the basics of pre-registration: a method for creating a permanent record of a research plan prior to conducting data collection and/or data analysis. We discuss the conceptual similarities and practical differences between pre-registration and registered reports and traditional approaches to educational research. We provide some practical advice from our own experiences using this practice in our own research and resources available for researchers interested in pre-registering their work. Finally, we end with questions and discussion about adopting pre-registration practices and unique considerations for implementing pre-registration in education research.
Different types of sensory systems with their functional modalities will be presented. …
Different types of sensory systems with their functional modalities will be presented. The biological bases for how these functions are generated and modified will then be described. Scientific information will be integrated into the lectures, such that students use critical skills in interpreting data, proposing hypotheses and designing experiments.
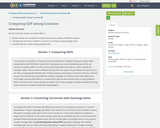
By the end of this section, you will be able to:Explain how …
By the end of this section, you will be able to:Explain how we can use GDP to compare the economic welfare of different nationsCalculate the conversion of GDP to a common currency by using exchange ratesCalculate GDP per capita using population data
Learn how to read and interpret maps and data and use basic …
Learn how to read and interpret maps and data and use basic cartography principles to create maps that can be used in reports and presentations. After learning basic concepts, attendees will work through an exercise using ArcGIS Pro or QGIS.
No restrictions on your remixing, redistributing, or making derivative works. Give credit to the author, as required.
Your remixing, redistributing, or making derivatives works comes with some restrictions, including how it is shared.
Your redistributing comes with some restrictions. Do not remix or make derivative works.
Most restrictive license type. Prohibits most uses, sharing, and any changes.
Copyrighted materials, available under Fair Use and the TEACH Act for US-based educators, or other custom arrangements. Go to the resource provider to see their individual restrictions.