This transfer activity tests student understanding of variation and inheritance. It starts …
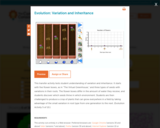
This transfer activity tests student understanding of variation and inheritance. It starts with five flower boxes, as in 'The Virtual Greenhouse,' and three types of seeds with variations in their roots. The flower boxes differ in the amount of water they receive, and students discover which seeds thrive in which environment. Students are then challenged to produce a crop of plants that can grow everywhere in a field by taking advantage of the small variation in root type from one generation to the next. (Evolution Activity 5 of 10.)
The evolution of paints has seen advancements from acrylics to smart coatings …
The evolution of paints has seen advancements from acrylics to smart coatings with self-healing and color-changing properties. Early developments included acrylics, water-based latex paints, polyurethane coatings, powder coatings, and nanotechnology. Breakthroughs introduced advanced smart coatings, graphene-based coatings, bioluminescent paints, and photocatalytic paints. The smart revolution brought self-healing coatings, responsive color-changing paints, anti-graffiti coatings, and hydrochromic/photochromic paints. Future applications include military use for camouflage and safety, energy efficiency, and solar paint for clean energy production.
This resource is a video abstract of a research paper created by …
This resource is a video abstract of a research paper created by Research Square on behalf of its authors. It provides a synopsis that's easy to understand, and can be used to introduce the topics it covers to students, researchers, and the general public. The video's transcript is also provided in full, with a portion provided below for preview:
"Drinking water is essential for life, but drinking water distribution systems can contain hidden ecosystems. Complex microbial communities reside in water and the systems used for water storage and distribution. To manage these microbes and keep drinking water safe, water treatment plants often use disinfectants like chlorine. Unfortunately, disinfectants may affect the safety of drinking water by potentially boosting the formation of harmful disinfection byproducts. A recent study assessed the effect of disinfection treatment on microbial communities in drinking water. Using metagenomics, researchers compared the microbiomes of disinfected and non-disinfected drinking water distribution systems. The results suggested that disinfected drinking water contains a less diverse microbiome than non-disinfected water, and disinfection may select for microorganisms that can feed off of decaying microbes..."
The rest of the transcript, along with a link to the research itself, is available on the resource itself.
Students use an EPA data set of Nevada mines to evaluate proximity …
Students use an EPA data set of Nevada mines to evaluate proximity of mine sites to streams to choose priority water sampling sites to evaluate for possible contamination. Students export data to Google Earth to use satellite imagery to narrow the priority sites further. You might also be interested in our Full GIS course with links to all assignments.
(Note: this resource was added to OER Commons as part of a batch upload of over 2,200 records. If you notice an issue with the quality of the metadata, please let us know by using the 'report' button and we will flag it for consideration.)
In this exercise, students process LiDAR data for the Hamilton College campus …
In this exercise, students process LiDAR data for the Hamilton College campus area to determine accurate elevations of wellheads of sampling wells on campus. Students use both GPS readings and orthophotos to determine wellhead locations and combine those with water levels, casing heights, and wellhead elevations to interpolate a groundwater surface under the campus and portray the groundwater in ArcScene. They also learn how to use Model Builder. You might also be interested in our Full GIS course with links to all assignments. You might also be interested in our webinar for the NYS GIS Association on A Simple Example of Working with LiDAR using ArcGIS and 3D Analyst.
(Note: this resource was added to OER Commons as part of a batch upload of over 2,200 records. If you notice an issue with the quality of the metadata, please let us know by using the 'report' button and we will flag it for consideration.)
This module consists of a laboratory exercise and related homework problems on …
This module consists of a laboratory exercise and related homework problems on geochemical kinetics of mineral-solution reactions for undergraduate mineralogy. Students measure the grain sizes of equant halite crystals, and the time for complete dissolution of each grain. From these data, students retrieve a rate law, from several possible. Additional homework problems allow various chemical and physical transport processes in mineral-fluid systems to be evaluated.
The lab and homework illustrate several basic principles of chemical kinetics directly relevant to geology, including rate laws of reactions, diffusion, advective transport, and the relationship between rate-limiting mechanisms and crystal-surface morphology.
(Note: this resource was added to OER Commons as part of a batch upload of over 2,200 records. If you notice an issue with the quality of the metadata, please let us know by using the 'report' button and we will flag it for consideration.)
1. Instructor identifies an appropriate number of key dates in the Precambrian …
1. Instructor identifies an appropriate number of key dates in the Precambrian to investigate. 2. Students break into groups (method to be determined by instructor) and each group will be assigned a particular time in the Precambrian (one author likes to have groups draw assignments out of hat!). 3. Students investigate their time period using appropriate source materials (we suggest the class notes, textbook and perhaps supplementary materials identified in the form of popular articles (e.g., Scientific American, Smithsonian, National Geographic, etc.) or websites. Questions
Using your prior knowledge of your time period, what scientific equipment might you want to take with you? What will you experience on your time travels? Is there a place to land? What is the temperature? Can you breathe the atmosphere? Do you need a life support system? What is the atmosphere composed of? Is there any water? What is its phase? Can you drink it? Do you see any life, or evidence of its presence? How would you recognize the life? What life do you expect to observe or not observe, and why? What questions were you able to answer with your trip? What questions were you unable to answer? What aspects of the environment at this time most surprised or stuck you?
4. Group presentation a) Create a very simple PowerPoint presentation (10 minutes) for the class. b) Each group member must present part of the information.
(Note: this resource was added to OER Commons as part of a batch upload of over 2,200 records. If you notice an issue with the quality of the metadata, please let us know by using the 'report' button and we will flag it for consideration.)
In this experiment, students use a solar cooker to model the greenhouse …
In this experiment, students use a solar cooker to model the greenhouse effect. Students collect, track, and compare data including insolation, ambient temperature, and water temperature with various instruments such as a pyranometer, thermometers, and temperature probes. They also develop their own experiments (incorporating set up, controls, data collection and presentation) to examine the strength of ultraviolet radiation from the sun with various protective materials using uv-sensitive beads. They must then analyze the data, finding correlations and conclusions, and determine the best way to present the results (tables, graphs, write-up).
(Note: this resource was added to OER Commons as part of a batch upload of over 2,200 records. If you notice an issue with the quality of the metadata, please let us know by using the 'report' button and we will flag it for consideration.)
In this unit, students wonder about the physical drivers of ocean movement, …
In this unit, students wonder about the physical drivers of ocean movement, explore density differences, and take a look at some tiny creatures who struggle to keep their place in the water column in the midst of all that ocean motion. Each unit of the Explore the Salish Sea curriculum contains a detailed unit plan, a slideshow, student journal, and assessments. All elements are adaptable and can be tailored to your local community.
In Unit 2 of the Explore the Salish Sea curriculum, students will …
In Unit 2 of the Explore the Salish Sea curriculum, students will review the water cycle, learn the parts of a watershed, and the effects of erosion and pollution, then learn ways of purifying these waters before they enter our streams and estuaries to safeguard these ecosystems for marine life and us. Each unit in this series contains a detailed unit plan, a slideshow, student journal, and assessments. All elements are adaptable and can be tailored to your local community.
In this unit, students will solve a mystery about changes in oyster …
In this unit, students will solve a mystery about changes in oyster larvae in the Salish Sea, causing oyster farmers to send their larvae to Hawaii until they grow stronger. They will look for clues in: • activities and games, articles, and films that introduce the concepts of habitat and ecosystem • structures and behaviors for survival in intertidal zone habitats • the Earth-moon-sun interactions that drive the tides • the importance of First Foods of the intertidal to first nations communities; • how intertidal organisms interact across the Salish Sea food web Afterward, they will arrive at the importance of a balanced carbon cycle in the health of the ocean and use a full scientific investigation to test if their local waters have a healthy pH for oyster larvae and other shelled creatures. Clear pathways of hope are woven into this complex issue, so students know that scientists and leaders are working to solve this problem - and kids can help!
Explore the global history of nuclear reactors from 1951 to 2022. This …
Explore the global history of nuclear reactors from 1951 to 2022. This visualization showcases 626 operational reactors, highlighting the dominance of pressurized light water reactors (PWRs). Different reactor types exhibit geographic patterns, with retired reactors and ongoing upgrades observed in various countries. The average age of reactors in the United States was 41 years in 2021.
In Massachusetts, Manchester-by-the-Sea's wastewater treatment plant is located right on the coast. …
In Massachusetts, Manchester-by-the-Sea's wastewater treatment plant is located right on the coast. The town's water utility is working with the EPA's Climate Ready Water Utilities program to consider its adaptation options.
Students observe multiple examples of capillary action. First they observe the shape …
Students observe multiple examples of capillary action. First they observe the shape of a glass-water meniscus and explain its shape in terms of the adhesive attraction of the water to the glass. Then they study capillary tubes and observe water climbing due to capillary action in the glass tubes. Finally, students experience a real-world application of capillary action by designing and using "capillary siphons" to filter water.
This activity has students work together to summarize regional effects of climate …
This activity has students work together to summarize regional effects of climate change and other environmental issues, which a focus on how these issues may influence agriculture and water availability. Students present a region to the group and create a layperson summary of the effects of climate change and other environmental change on their region.
(Note: this resource was added to OER Commons as part of a batch upload of over 2,200 records. If you notice an issue with the quality of the metadata, please let us know by using the 'report' button and we will flag it for consideration.)
Average inquiry level: Structured This groundwater lab is designed for online, asynchronous …
Average inquiry level: Structured This groundwater lab is designed for online, asynchronous instruction and uses Google slides (or Powerpoint) so student can use the draw features. Within this lab, students will:
Evaluate and conclude the seasonal and annual trends of the water table from data monitored groundwater wells; Predict and assess the permeability and porosity of different substrates and rocks;Â Create a contour map and cross-section of the water table given data from multiple wells and draw the flow direction of water; Predict and communicate the changes of the water table that could occur in response to different water-related scenarios; Determine solutions for an area experiencing groundwater problems.
(Note: this resource was added to OER Commons as part of a batch upload of over 2,200 records. If you notice an issue with the quality of the metadata, please let us know by using the 'report' button and we will flag it for consideration.)
In this activity, students use real water chemistry data and descriptive statistics …
In this activity, students use real water chemistry data and descriptive statistics in Excel to examine primary productivity in an urban estuary of the Salish Sea. They will consider how actual data do or do not support expected annual trends.
This is a teacher demonstration used to show an example of kinetic …
This is a teacher demonstration used to show an example of kinetic molecular energy using food coloring and water. The students are also given opportunity to develop their own questions and tests.
No restrictions on your remixing, redistributing, or making derivative works. Give credit to the author, as required.
Your remixing, redistributing, or making derivatives works comes with some restrictions, including how it is shared.
Your redistributing comes with some restrictions. Do not remix or make derivative works.
Most restrictive license type. Prohibits most uses, sharing, and any changes.
Copyrighted materials, available under Fair Use and the TEACH Act for US-based educators, or other custom arrangements. Go to the resource provider to see their individual restrictions.