Updating search results...

Search Resources

1446 Results

View
Selected filters:
  • climate-change
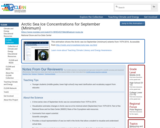
Arctic Sea Ice Concentrations for September (Minimum)
Read the Fine Print
Rating
0.0 stars

This animation shows the Arctic sea ice September (minimum) extents from 1979-2016. Accessible from http://nsidc.org/cryosphere/sotc/sea_ice.html

Subject:
Applied Science
Career and Technical Education
Environmental Science
Environmental Studies
Oceanography
Physical Science
Provider:
CLEAN: Climate Literacy and Energy Awareness Network
Provider Set:
CLEAN: Climate Literacy and Energy Awareness Network
Author:
National Snow and Ice Data Center
Date Added:
09/24/2018
Arctic Sea Ice Extent
Conditional Remix & Share Permitted
CC BY-NC-SA
Rating
0.0 stars

Student teams investigate Arctic Sea Ice by analyzing actual data and making predictions. A worthwhile extension is to predict the first year that the Arctic Ocean will be ice free.

(Note: this resource was added to OER Commons as part of a batch upload of over 2,200 records. If you notice an issue with the quality of the metadata, please let us know by using the 'report' button and we will flag it for consideration.)

Subject:
Applied Science
Biology
Environmental Science
Life Science
Mathematics
Measurement and Data
Statistics and Probability
Material Type:
Activity/Lab
Provider:
Science Education Resource Center (SERC) at Carleton College
Provider Set:
Teach the Earth
Author:
Bill Bauldry
Date Added:
04/17/2018
Arctic Sea Ice Is Losing Its Bulwark
Read the Fine Print
Rating
0.0 stars

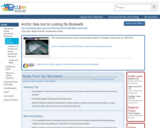
This visualization shows static and animated images of changes in Arctic sea ice 1984-2016.

Subject:
Applied Science
Career and Technical Education
Environmental Science
Environmental Studies
Physical Science
Provider:
CLEAN: Climate Literacy and Energy Awareness Network
Provider Set:
CLEAN: Climate Literacy and Energy Awareness Network
Author:
Cindy Starr
NASA Scientific Visualization Studio.
Date Added:
09/24/2018
Arctic Tundra May Contribute to Warmer World
Read the Fine Print
Educational Use
Rating
0.0 stars

In this audio slideshow, an ecologist from the University of Florida describes the radiocarbon dating technique that scientists use to determine the amount of carbon within the permafrost of the Arctic tundra. Understanding the rate of carbon released as permafrost thaws is necessary to understand how this positive feedback mechanism is contributing to climate change that may further increase global surface temperatures.

Subject:
Applied Science
Career and Technical Education
Environmental Science
Environmental Studies
Physical Science
Material Type:
Diagram/Illustration
Reading
Provider:
CLEAN: Climate Literacy and Energy Awareness Network
Provider Set:
CLEAN: Climate Literacy and Energy Awareness Network
Author:
National Science Foundation
University of Florida
Date Added:
05/15/2012
Arctic Youth Climate Stories
Conditional Remix & Share Permitted
CC BY-NC
Rating
0.0 stars

SYNOPSIS: In this lesson, students learn some of the impacts climate change is having on the Arctic, hear youth perspectives about the impacts of climate change, and write their own personal climate stories.

SCIENTIST NOTES: Students are instructed in this lesson on the effects of climate change on the Arctic region. Temperature increases are hastening the melting of permafrost, glaciers, and sea level rise. This has an effect on the polar ecosystems and human populations. The contrast between how climate change affects the northern and southern regions of the Arctic is also covered in the lesson, along with suggestions for how students may learn and share their experiences to promote climate action. This lesson passed our science review process after all the materials were fact-checked.

POSITIVES:
-This lesson can be used in any middle school writing class and tailored to the specific skills the class is working on.
-This lesson helps students connect climate change to people.
-This lesson highlights a local community in the Arctic and demonstrates the impact storytelling can have.
-This lesson encourages students to participate in the writing process, including the planning and publishing stages.
-This lesson allows teachers to integrate skills specific to their students.

ADDITIONAL PREREQUISITES:
-The Inquire section gallery walk is about the student-made infographics from the previous lesson. Alternatively, teachers can use the infographics from the Teacher Slideshow.
-Students should understand the basics of writing a story. This includes, but is not limited to, characters, setting, rising action, climax, falling action, and resolution.
-When teaching this lesson teachers should have a baseline understanding of how climate change works and understand some of the impacts in the Arctic.
-In this lesson the term, “story” is consistently used, despite one of the primary standards referring to the term, “narrative.” If students ask to clarify the difference, one way a middle school ELA teacher can differentiate personal narratives from stories is that a personal narrative is a true story whereas a story can be fictionalized.
-For their writing, students will need a basic understanding of the ways climate change is affecting their own communities.

DIFFERENTIATION:
-The final draft of the writing can be used as a summative assessment for this lesson.
-It may be helpful to share a map and show where the Arctic is located if students are unfamiliar.
-Students may need more specific and individual guidance when planning out their writing. Rubrics can be customized for individual students and their learning goals.
-Teachers can give students more time for writing the personal climate story.

Subject:
English Language Arts
Material Type:
Lesson Plan
Provider:
SubjectToClimate
Author:
Elizabeth Ward
Jennifer Williams
Date Added:
06/29/2023
The Arctic in Infographics
Conditional Remix & Share Permitted
CC BY-NC
Rating
0.0 stars

SYNOPSIS: This lesson introduces students to the impacts of climate change on the Arctic.

SCIENTIST NOTES: This lesson demonstrates the impacts of climate change on the Arctic region and thus provides a background for students to reflect on the causal relationship between temperature changes and ice melting, glaciers, permafrost, and sea level rise. Accordingly, this lesson is interactive, properly cited, and has passed our science credibility.

POSITIVES:
-This lesson situates the Arctic globally and introduces students to people who call the Arctic home, including youth.
-Alongside climate change, students learn about infographics as a way to understand and share information.

ADDITIONAL PREREQUISITES:
-For the game “Is It an Infographic?” game, teachers should present the Teacher Slideshow in slideshow mode to conceal the answer at first glance.
-When teaching this lesson, teachers should have a baseline understanding of how climate change works. This short interactive course offers easy-to-understand information on the basics of climate change.
-Teachers will need to plan ahead for the gallery walk.

DIFFERENTIATION:
-If teachers would like to spend more time on the infographic, both in teaching about infographics as a way to share information and on how to create an infographic, this website is an excellent resource.
-Infographic creation could be digital, adding technology skills to the outcomes, if students have access to technology and the appropriate software.

Subject:
English Language Arts
Physical Geography
Physical Science
Social Science
Material Type:
Lesson Plan
Provider:
SubjectToClimate
Author:
Elizabeth Ward
Jennifer Williams
Date Added:
06/29/2023
Are Humans Influencing Modern Climate?
Read the Fine Print
Rating
0.0 stars

In this short video, host Dr. Ryan interviews graduate student Amy Steiker at the Institute of Arctic and Alpine Research about her research, using isotopes of nitrous oxide, connecting human activity to greenhouse gas emissions.

Subject:
Applied Science
Atmospheric Science
Career and Technical Education
Environmental Science
Environmental Studies
Physical Science
Provider:
CLEAN: Climate Literacy and Energy Awareness Network
Provider Set:
CLEAN: Climate Literacy and Energy Awareness Network
Author:
Ryan Vachon
University of Colorado Outreach
Date Added:
09/24/2018
Are Other Parts of the World Getting Hotter?
Conditional Remix & Share Permitted
CC BY-NC
Rating
0.0 stars

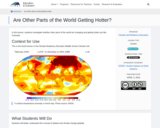
In this lesson, students investigate whether other parts of the world are changing and getting hotter just like Colorado.

Subject:
Applied Science
Atmospheric Science
Environmental Science
Physical Science
Material Type:
Lesson
Provider:
University of Colorado Boulder
Provider Set:
Cooperative Institute for Research in Environmental Sciences (CIRES)
Date Added:
04/05/2018
Are Winters Getting Worse?
Conditional Remix & Share Permitted
CC BY-NC
Rating
0.0 stars

SYNOPSIS: In this lesson, students discover how climate change could be making extreme winter weather worse.

SCIENTIST NOTES: This is a great lesson that explains key drivers of winter storms. Students will learn about the polar vortex and lake effect snow and how they influence the jet stream, air circulation, and polar and mid-latitude climates. The cascading effect is worrisome, especially in vulnerable communities. The class activity will inspire students to communicate ways communities could respond to these weather events. The videos, materials, charts, and datasets embedded in the lesson were fact-checked, and this lesson has passed our science review process.

POSITIVES:
-Connecting climate change and extreme winter weather can feel counterintuitive, which will challenge students' critical thinking skills.
-The lesson provides many opportunities for students to share ideas with their peers.
-This lesson can be taught in an environmental science class.

ADDITIONAL PREREQUISITES:
-Advertisements may play before some of the videos.
-Students should be familiar with climate change, the difference between weather and climate, and the various types of extreme weather.
-Teachers should make it clear that on average, global temperatures are rising even if there is sometimes more extreme cold and snowy weather.
-Teachers should make sure students understand that this lesson is not about if anthropogenic climate change is real. Instead, this lesson is looking at the specific connections between climate change and the polar vortex and lake effect snow.

DIFFERENTIATION:
-For students who may need more support in the Investigate section, classes can create their explanations of the polar vortex and lake effect snow together.
-This lesson could be split over two class periods. In the first class, students would complete the Inquire section and the first half of the Investigate section about the polar vortex. In the second class, students would complete the second half of the Investigate section about lake effect snow and the Inspire section.

Subject:
Geoscience
Physical Science
Space Science
Material Type:
Lesson Plan
Provider:
SubjectToClimate
Author:
Effie Albitz
Date Added:
06/30/2023
Are You An Energy Efficient Consumer?
Read the Fine Print
Rating
0.0 stars

This activity engages students in learning about ways to become energy efficient consumers. Students examine how different countries and regions around the world use energy over time, as reflected in night light levels. They then track their own energy use, identify ways to reduce their individual energy consumption, and explore how community choices impact the carbon footprint.

Subject:
Geoscience
Physical Science
Material Type:
Activity/Lab
Provider:
CLEAN: Climate Literacy and Energy Awareness Network
Provider Set:
CLEAN: Climate Literacy and Energy Awareness Network
Author:
Marian Koshland Science Museum of the National Academy of Sciences
Date Added:
10/27/2014
Art and Climate Action (Climate Heroes #1)
Conditional Remix & Share Permitted
CC BY-NC
Rating
0.0 stars

SYNOPSIS: In this lesson, students investigate how artists use their platforms to spread awareness about climate change.

SCIENTIST NOTES: This lesson encourages students to think about how artists and their art can be used to teach and inspire others about climate change. Many videos are included in the slideshow. Videos include one of Sarah Lewis, an art historian discussing how one person’s artwork can shift things, and a second one featuring “Earthrise,” a poem by Amanda Gorman, the youngest inaugural poet in U.S. history. There are an additional six videos covering artists and their artwork about climate change. This lesson finishes with great reflection questions and an opportunity for class discussion. This would be a great lesson for teaching the effects of art on the public perception of climate change.

POSITIVES:
-Students consider the role of art as a form of climate activism.
-Students are exposed to a variety of artists and types of art addressing climate change.
-This lesson has significant cross-curricular possibilities, even though it focuses on art and artists.
-Students begin to think about ways they might use artwork as a means of taking climate action.

ADDITIONAL PREREQUISITES:
-This is lesson 1 of 3 in our 9th-12th grade Climate Heroes unit.
-This lesson should follow a basic introduction to climate change science, exploration of global and local impacts, and climate change solutions.
-Some prior knowledge of contemporary art practices is useful, but not required.

DIFFERENTIATION:
-Teachers can provide instruction multimodally.
-Teachers can modify the assignment and assessment as needed.
-Teachers can follow up with questions to ensure comprehension.
-Teachers can pair students with helpful peers.

Subject:
Art History
Arts and Humanities
Visual Arts
Material Type:
Activity/Lab
Lesson
Lesson Plan
Provider:
SubjectToClimate
Author:
Carolyn McGrath
Subject to Climate
Date Added:
04/06/2023
Artistic Slogans & Parallel Structure
Conditional Remix & Share Permitted
CC BY-NC
Rating
0.0 stars

SYNOPSIS: In this lesson, students evaluate three slogans on climate awareness and advocacy and create their own artistic slogans with four specific types of parallel structure.

SCIENTIST NOTES: The lesson enables students to understand the intrinsic value of slogans in climate and social justice advocacy. Students would also practice how to use artistic slogans to communicate climate change impact to diverse audiences and policymakers in order to inform better decision-making and drive climate action. All materials have been carefully reviewed, and this lesson is recommended for teaching.

POSITIVES:
-This lesson can be used in all levels of English and art classes.
-Art teachers can use this lesson in any unit and incorporate other art components.
-Students are given voice and choice in this lesson as they learn to manipulate language to achieve different outcomes.
-This lesson can be used as an introduction to climate change and overall climate awareness.
-This lesson can be added to a science lesson evaluating evidence for climate change or a communications or business lesson on marketing.
-This lesson can be used to discuss climate justice in social studies.

ADDITIONAL PREREQUISITES:
-Students should have some understanding of basic grammar and parallel structure.
-Students should have an understanding of slogans and their purpose.
-Students should have access to computers or art materials in order to create the final version of their parallel structure slogan.

DIFFERENTIATION:
-Students’ use of language and vocabulary can be simple or complex in order to fit the needs of the class.
-Teachers can simplify the lesson by focusing on only one or two forms of parallel structure.
-Art teachers can have students design two different visual pieces to go with the same slogan, then compare and contrast the effects of the different artistic elements on the overall message.
-Additional scaffolding for AP English classes can include a discussion on the purposes and effects of each specific form of parallel structure as well as an analysis of parallel structures in literature.
-Teachers can connect the parallel structure skills in this lesson to their current reading material or curriculum. For example, students can identify forms of parallel structure in previously assigned class literature or nonfiction readings.
-Teachers can extend this lesson into various writing activities for students to practice expository, analytical, descriptive, or narrative writing with different forms of parallel structure.

Subject:
English Language Arts
Material Type:
Lesson Plan
Provider:
SubjectToClimate
Author:
Yen-Yen Chiu
Date Added:
06/29/2023
Artists, Information Literacy & Climate Change
Conditional Remix & Share Permitted
CC BY-NC-SA
Rating
0.0 stars

This unit explores the various ways information and ideas about climate change are presented through a variety of media. This includes the evaluation of social media posts, research into climate change issues, and an exploration of contemporary art and artists. This was designed and taught in an honors 9th grade English Language Arts Classroom by Dr. Tavia Quaid in response to student interest in climate change and to reinforce key information literacy skills.

Subject:
Environmental Science
Environmental Studies
Measurement and Data
Reading Informational Text
Visual Arts
Material Type:
Assessment
Diagram/Illustration
Homework/Assignment
Lesson Plan
Reading
Author:
Shana Ferguson
Date Added:
04/21/2021
Artists, Information Literacy & Climate Change
Conditional Remix & Share Permitted
CC BY-NC-SA
Rating
0.0 stars

This unit explores the various ways information and ideas about climate change are presented through a variety of media. This includes the evaluation of social media posts, research into climate change issues, and an exploration of contemporary art and artists. 

Subject:
Environmental Science
Environmental Studies
Measurement and Data
Reading Informational Text
Visual Arts
Material Type:
Activity/Lab
Diagram/Illustration
Lesson
Reading
Author:
Levi Duquette
Date Added:
12/08/2021
The Art of Climate Change
Conditional Remix & Share Permitted
CC BY-NC
Rating
0.0 stars

SYNOPSIS: In this lesson, students investigate the effectiveness of visual art in addressing climate change.

SCIENTIST NOTES: Simply put, not everyone is swayed by a scientific expert. Often it takes other means to convey a message to someone. That is why is an integral part of climate change communication. Art, scientifically, has a different impact on our thoughts and decision-making than hearing a lecture from an expert. This lesson explores different climate change art projects and shows their potential to reach audiences. This lesson has passed the scientific review process.

POSITIVES:
-Students learn that art can be used to address issues that are usually just discussed in scientific terms.
-Students learn about a variety of artists whose work deals with climate change.
-Students can begin to visualize ways that they might make art about climate change, which can serve as a subsequent lesson.
-This lesson is interactive and simulates a real-world situation in the art world, requiring a variety of skills.

ADDITIONAL PREREQUISITES:
-This lesson can be paired with or follow a more in-depth discussion of climate change science.
-Students should know how to use Google Slides or a similar type of presentation format.
-Students should have a basic familiarity with rubrics.

DIFFERENTIATION:
-Teachers can provide instruction multimodally.
-Teachers can preview vocabulary with ESL students.
-Teachers can follow up with questions to ensure comprehension.
-Teachers can pair students with helpful peers.
-It can be beneficial for developing students’ interpersonal skills if groups were randomized.

Subject:
Arts and Humanities
Visual Arts
Material Type:
Lesson Plan
Provider:
SubjectToClimate
Author:
Carolyn McGrath
Date Added:
06/29/2023
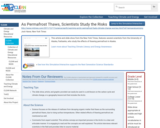
As Permafrost Thaws, Scientists Study the Risks
Read the Fine Print
Educational Use
Rating
0.0 stars

This article and slide show from the New York Times, features several scientists from the University of Alaska, Fairbanks, who study the effects of thawing permafrost in Alaska.

Subject:
Applied Science
Biology
Career and Technical Education
Chemistry
Environmental Science
Environmental Studies
Geology
Life Science
Physical Science
Material Type:
Reading
Simulation
Provider:
CLEAN: Climate Literacy and Energy Awareness Network
Provider Set:
CLEAN: Climate Literacy and Energy Awareness Network
Author:
Josh Haner
New York Times
Date Added:
08/29/2012
Assess burn scars with satellite imagery
Read the Fine Print
Educational Use
Rating
0.0 stars

Using Landsat 8 imagery from before and after the 2015 wildfire season in Glacier National Park, Montana, learners calculate the damage using a Normalized Burn Index, digitize the burn area, and publish to ArcGIS Online.

Subject:
Applied Science
Atmospheric Science
Career and Technical Education
Ecology
Environmental Science
Environmental Studies
Life Science
Physical Science
Material Type:
Activity/Lab
Provider:
CLEAN: Climate Literacy and Energy Awareness Network
Provider Set:
CLEAN: Climate Literacy and Energy Awareness Network
Author:
ArcGIS
Date Added:
07/07/2021
Assessing Climate Risks in a National Estuary
Unrestricted Use
Public Domain
Rating
0.0 stars

Stakeholders of the Morro Bay National Estuary Program in California worked with resources from the EPA's Climate Ready Estuaries program to identify their climate risks. Their results helped them prioritize actions for building resilience.

Subject:
Atmospheric Science
Physical Science
Material Type:
Case Study
Provider:
National Oceanic and Atmospheric Administration
Provider Set:
U.S. Climate Resilience Toolkit
Date Added:
09/20/2016
Assessing Drought in the United States
Read the Fine Print
Educational Use
Rating
0.0 stars

This easy-to-understand video animation describes drought and explains the different categories of drought used by the drought monitor. It discusses the effects of and contributions to drought, what the implications of the different drought levels are, and puts the drought maps into context to understand how the impacts vary geographically (e.g. drought in Nevada vs Kansas - one could affect tourism, the other agriculture). It also touches on how the development of maps/drought severity is determined and how it might vary geographically. The animation provides a basic overview of statistics and percentiles and the concept of '100 year events.'

Subject:
Agriculture
Applied Science
Atmospheric Science
Career and Technical Education
Economics
Environmental Science
Environmental Studies
Physical Science
Social Science
Material Type:
Diagram/Illustration
Reading
Provider:
CLEAN: Climate Literacy and Energy Awareness Network
Provider Set:
CLEAN: Climate Literacy and Energy Awareness Network
Author:
CoCoRaHS
Colorado Climate Center
Date Added:
06/25/2019
Assessing Local Sea Level Rise
Conditional Remix & Share Permitted
CC BY-NC-SA
Rating
0.0 stars

Students will read primary scientific literature, work collaboratively, think critically, and utilize GIS as a tool to visualize and quantify spatial and temporal changes in hydrological systems.

(Note: this resource was added to OER Commons as part of a batch upload of over 2,200 records. If you notice an issue with the quality of the metadata, please let us know by using the 'report' button and we will flag it for consideration.)

Subject:
Applied Science
Biology
Career and Technical Education
Environmental Science
Environmental Studies
Life Science
Oceanography
Physical Science
Material Type:
Activity/Lab
Provider:
Science Education Resource Center (SERC) at Carleton College
Provider Set:
Teach the Earth
Author:
Ken Tabbutt
Date Added:
07/06/2017