Lecture for the course "CS 217 – Probability and Statistics for Computer …
Lecture for the course "CS 217 – Probability and Statistics for Computer Science" delivered at the City College of New York in Spring 2019 by Evan Agovino as part of the Tech-in-Residence Corps program.
Lecture for the course "CS 217 – Probability and Statistics for Computer …
Lecture for the course "CS 217 – Probability and Statistics for Computer Science" delivered at the City College of New York in Spring 2019 by Evan Agovino as part of the Tech-in-Residence Corps program.
Lecture for the course "CS 217 – Probability and Statistics for Computer …
Lecture for the course "CS 217 – Probability and Statistics for Computer Science" delivered at the City College of New York in Spring 2019 by Evan Agovino as part of the Tech-in-Residence Corps program.
The purpose of this course is to expose you to the wider …
The purpose of this course is to expose you to the wider world of mathematical thinking. There are two reasons for this. First, for you to understand the power of quantitative thinking and the power of numbers in solving and dealing with real world scenarios. Secondly, for you to understand that there is more to mathematics then expressions and equations. The core course is a complete, ready to run, fully online course, featuring 9 topics: Problem solving, voting theory, graph theory, growth models, consumer finance, collecting data, describing data, probability, and historical counting. Additional optional topics are provided. The course materials can easily be used with a face-to-face course.
This lesson unit is intended to help you assess how well students …
This lesson unit is intended to help you assess how well students are able to: Calculate the mean, median, mode, and range from a frequency chart; and to use a frequency chart to describe a possible data set, given information on the mean, median, mode, and range.
This lesson unit is intended to help teachers assess how well students …
This lesson unit is intended to help teachers assess how well students are able to: make sense of a real life situation and decide what math to apply to the problem; understand and calculate the conditional probability of an event A, given an event B, and interpret the answer in terms of a model; represent events as a subset of a sample space using tables, tree diagrams, and Venn diagrams; and interpret the results and communicate their reasoning clearly.
This lesson unit is intended to help teachers assess how well students …
This lesson unit is intended to help teachers assess how well students are able to: Understand conditional probability; represent events as a subset of a sample space using tables and tree diagrams; and communicate their reasoning clearly.
This lesson unit is intended to help teachers assess how well students …
This lesson unit is intended to help teachers assess how well students understand conditional probability, and, in particular, to help teachers identify and assist students who have the following difficulties: representing events as a subset of a sample space using tables and tree diagrams; and understanding when conditional probabilities are equal for particular and general situations.
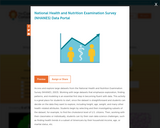
Access and explore large datasets from the National Health and Nutrition Examination …
Access and explore large datasets from the National Health and Nutrition Examination Survey (NHANES, 2003). Working with large datasets that emphasize exploration, finding patterns, and modeling is an essential first step in becoming fluent with data. This activity is a great place for students to start, since the dataset is straightforward and students can decide on the data they want to explore, including height, age, weight, and many other health-related attributes. Students begin by selecting and then investigating subsets of the dataset, for example, to find the cholesterol level of U.S. citizens. Then, working with their classmates or individually, students can try their own data science challenges, such as finding health trends in a subset of Americans by their household income, age, or marital status, etc.
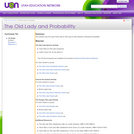
Online Statistics: An Interactive Multimedia Course of Study is an introductory-level statistics …
Online Statistics: An Interactive Multimedia Course of Study is an introductory-level statistics book. The material is presented both as a standard textbook and as a multimedia presentation. The book features interactive demonstrations and simulations, case studies, and an analysis lab.
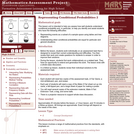
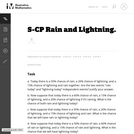
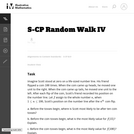
This task provides a context to calculate discrete probabilities and represent them …
This task provides a context to calculate discrete probabilities and represent them on a bar graph. It could also be used to create a class activity where students gather, represent, and analyze data, running simulations of the random walk and recording and then displaying their results.
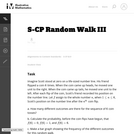
This task completes the line of reasoning of Random Walk III in …
This task completes the line of reasoning of Random Walk III in a situation where the numbers become too large to calculate and so abstract reasoning is required in order to compare the different probabilities. It is intended for instructional purposes only with a goal of understanding how to calculate and compare the combinatorial symbols.
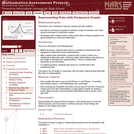
This lesson unit is intended to help teachers assess how well students: …
This lesson unit is intended to help teachers assess how well students: are able to use frequency graphs to identify a range of measures and make sense of this data in a real-world context; and understand that a large number of data points allow a frequency graph to be approximated by a continuous distribution.
This lesson unit is intended to help teachers assess how well students …
This lesson unit is intended to help teachers assess how well students are able to interpret data using frequency graphs and box plots. In particular this unit aims to identify and help students who have difficulty figuring out the data points and spread of data from frequency graphs and box plots. It is advisable to use the lesson: Representing Data 1: Frequency Graphs, before this one.
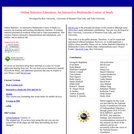
This is a task from the Illustrative Mathematics website that is one …
This is a task from the Illustrative Mathematics website that is one part of a complete illustration of the standard to which it is aligned. Each task has at least one solution and some commentary that addresses important aspects of the task and its potential use.
No restrictions on your remixing, redistributing, or making derivative works. Give credit to the author, as required.
Your remixing, redistributing, or making derivatives works comes with some restrictions, including how it is shared.
Your redistributing comes with some restrictions. Do not remix or make derivative works.
Most restrictive license type. Prohibits most uses, sharing, and any changes.
Copyrighted materials, available under Fair Use and the TEACH Act for US-based educators, or other custom arrangements. Go to the resource provider to see their individual restrictions.