An attempt to help students better understand both the nature of river …
An attempt to help students better understand both the nature of river flow and its significance to human society, this lab follows the historic efforts of the Army Corps of Engineers to 'improve' the Mississippi River channel for commercial navigation. Students start by taking a section of the natural river channel and designing a river management program of wing dam and riprap construction that would manipulate the river's natural erosion and deposition processes to force the river itself to carve a deeper, more navigable channel. They then compare their plan to the one designed by the Corps and consider the implications of any significant differences between the two schemes. They are then asked to determine the environmental consequences of their proposed plan on the greater river system.
After this initial exploration, students compare the Corp's early efforts at wing dam and riprap management with its later plan of lock and dam construction and again investigate the impact of the two management schemes on the greater river system. The lab also considers differences in the cultural perspectives of 19th century Dakota and Euro-American communities regarding river systems. In concluding essays, the students must consider the environmental aspects of river management, specifically recognizing what was lost from the river system the Dakota originally knew.
(Note: this resource was added to OER Commons as part of a batch upload of over 2,200 records. If you notice an issue with the quality of the metadata, please let us know by using the 'report' button and we will flag it for consideration.)
Images of the James River in Virginia, including one at flood stage, …
Images of the James River in Virginia, including one at flood stage, and of potholes, all of which can be used to have the students make observations, estimates, and interpretations.
(Note: this resource was added to OER Commons as part of a batch upload of over 2,200 records. If you notice an issue with the quality of the metadata, please let us know by using the 'report' button and we will flag it for consideration.)
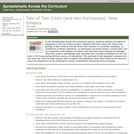
Student materials for this exercise include a Microsoft Excel spreadsheet with peak …
Student materials for this exercise include a Microsoft Excel spreadsheet with peak discharge data for the Hillsborough River and Curiosity Creek, a .zip file containing two versions (PDF and JPG) of the topographic map of the Sulphur Springs quadrangle, and a simplified sketch map of the quadrangle. The exercise is divided into three parts. In Part I, students study the Sulphur Springs topographic quadrangle to gain a general idea of the landscape. The students identify drainage divides on the quadrangle and outline the drainage basins on the sketch map. Part II includes calculating the frequency and probability of various sized floods and creating a recurrence curve using Microsoft Excel charts. Students apply their knowledge to decide whether to buy a house on the floodplain of the Hillsborough River. In Part III, students use their results to interpret the potential for flooding along the main river and one of its tributaries. Students compare recurrence curves to deduce that having more years of data leads to a more reliable flood forecast. They search online to determine the reasons for particular floods and contrast the effects on the two streams.
(Note: this resource was added to OER Commons as part of a batch upload of over 2,200 records. If you notice an issue with the quality of the metadata, please let us know by using the 'report' button and we will flag it for consideration.)
After collecting stream flow data in the field earlier in the semester, …
After collecting stream flow data in the field earlier in the semester, students collect new data to compare flow variations of an on-campus stream. Students collect data in the field then calculate flow velocity, and discharge. Students also use maps to calculate stream gradient. Additional activities include plotting clast size data collected in the field on a Hjulstrom Diagram to make connections between stream flow properties and erosion-deposition-and transport in streams. This activity gives students the opportunity to collect and analyze data as they practice quantitative skills by graphing data and calculating unit conversions.
(Note: this resource was added to OER Commons as part of a batch upload of over 2,200 records. If you notice an issue with the quality of the metadata, please let us know by using the 'report' button and we will flag it for consideration.)
An activity/lab where students determine the changes in 100-year flood determinations for …
An activity/lab where students determine the changes in 100-year flood determinations for 2 streams over time.
(Note: this resource was added to OER Commons as part of a batch upload of over 2,200 records. If you notice an issue with the quality of the metadata, please let us know by using the 'report' button and we will flag it for consideration.)
This project is designed to introduce students to a local hydrogeologic problem …
This project is designed to introduce students to a local hydrogeologic problem or issue of interest to the community. The project requires the students to learn about their local groundwater environment and apply principles and concepts that they learn in the classroom to an issue that is of concern to the public. This project provides a good introduction to "real world" problems that the students are likely to encounter as professionals. Students are required to synthesize information from a variety of sources and develop their own assessment of the problem and also to make recommendations based on their professional opinions.
(Note: this resource was added to OER Commons as part of a batch upload of over 2,200 records. If you notice an issue with the quality of the metadata, please let us know by using the 'report' button and we will flag it for consideration.)
Students are introduced to a simple approach to scientific writing. To make …
Students are introduced to a simple approach to scientific writing. To make the writing process immediately relevant to them, I present the approach after they have started the first assignment of the semester (whether lab or homework) but before it is due. Thus, students are more attentive to the presentation and are more invested in trying to apply the approach to a current assignment. As a class, we begin by answering the question "what did you do?" followed by answering the questions "who, what, where, when, how, and why?" as appropriate to develop the first paragraph/section. Next, we answer the question "what did you find?" followed by the questions "who, what, where, when, how, and why?" as appropriate to develop the second paragraph/section. Finally, we review what we have written and add the finishing touches (e.g., title, references, figures, etc.). Thus, students learn how to pose and answer basic questions that form the basis of a scientific report.
(Note: this resource was added to OER Commons as part of a batch upload of over 2,200 records. If you notice an issue with the quality of the metadata, please let us know by using the 'report' button and we will flag it for consideration.)
Spreadsheets Across the Curriculum/Geology of National Parks module. Students use the geometric …
Spreadsheets Across the Curriculum/Geology of National Parks module. Students use the geometric mean and multiplicative standard deviation to examine the right-skewed distribution of nutrient concentrations in water-quality data at Mammoth Cave National Park.
The course discusses several Geopgraphical Information System (GIS) and Remote Sensing (RS) …
The course discusses several Geopgraphical Information System (GIS) and Remote Sensing (RS) tools relevant for analysis of (problems in and aspects of) water systems. Within the course, several applications are introduced. These applications include GIS tools to determine mapping of surface water systems (catchment delineation, reservoirs and canal systems). The RS tools include determination of evaporation and soil moisture patterns, and measurement of water levels in surface water systems. In exercises and lectures, different tools and applications are offered. For each application, assignments are given to allow students to acquire relevant skills. The course structure combines assignments and introductory lectures. Each week participants work on one assignment. These assignments are discussed in the next lecture and graded. Each week a new assignment is introduced, together with supporting materials (an article discussing the relevant application) and lectures (introducing theoretical issues). The study material of the course consists of a study guide, assignments, lecture material and articles. The final mark is the average of the grades of the individual assignments.
This activity is a field investigation using science inquiry and problem solving, …
This activity is a field investigation using science inquiry and problem solving, where small groups of students design their own experiment to determine stream velocity, collect and analyze their data, draw conclusions, and make further inferences based group discussion/collaboration.
In this activity, students focus on ecosystem services specifically related to the …
In this activity, students focus on ecosystem services specifically related to the hydrologic cycle. Using rainfall-runoff data for a small watershed in Ohio, students are introduced to the technical vocabulary associated with watersheds, watershed hydrology, and water balance. Working with hydrologic data will enable the students to test their understanding of watershed hydrology and the water balance equation, which is a measure of how much water is stored within different parts of the watershed.
(Note: this resource was added to OER Commons as part of a batch upload of over 2,200 records. If you notice an issue with the quality of the metadata, please let us know by using the 'report' button and we will flag it for consideration.)
Students will conduct a virtual exploration of Harrier Meadow, a saltmarsh in …
Students will conduct a virtual exploration of Harrier Meadow, a saltmarsh in the New Jersey Meadowlands. They will identify its vulnerability to pollution, its tidal connection to the Hackensack Estuary and the Atlantic Ocean along with its proximity to New York City. Vegetation patterns within this wetland will be explored, focusing on a salinity tolerant native plant (Pickleweed) that is returning to the marsh. The return of such native species is critically important to wetland restoration efforts that aim to reclaim native habitat following decades of environmental degradation since the industrial revolution. These vegetation patterns are the focus of resistivity and electromagnetic surveys that the students explore in the subsequent units of this module. The geophysical surveys aim to better understand the underlying factors controlling the distribution of Pickleweed. By understanding where the Pickleweed is thriving, restoration efforts could subsequently be improved by locating regions of such wetlands with similar underlying factors where Pickleweed (and other native plants) could be successfully reintroduced. In the first unit of this module, students will use Google Earth (on the web), high-resolution video acquired from an Unmanned Aerial Vehicle (UAV) and an ArcGIS Storymap in their exploration. Primary outcome: students comprehend the association between salinity and Pickleweed and formulate plans to test a hypothesis for Pickleweed persistence/patterning in Harrier Meadow that will ultimately be implemented using near surface geophysical methods in the remaining units of the module.
(Note: this resource was added to OER Commons as part of a batch upload of over 2,200 records. If you notice an issue with the quality of the metadata, please let us know by using the 'report' button and we will flag it for consideration.)
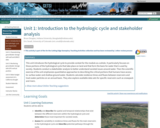
This unit introduces the hydrological cycle to provide context for the module …
This unit introduces the hydrological cycle to provide context for the module as a whole. It particularly focuses on those portions of the hydrological cycle that take place on land and that form the basis for water that is used by society. Students conduct a stakeholder analysis to better understand societal issues around water. Then the scientific exercise of the unit emphasizes quantitative approaches to describing the critical portions that humans have access to: surface water and shallow ground water. Students calculate residence times and fluxes between reservoirs and track water particles on an annual basis. They also explore available data sets for specific reservoirs such as snowpack and rivers.
Show more about Online Teaching suggestions Hide Online-adaptable: This exercise could be converted to online whole-class discussions/lectures and a breakout group activity. Would be best done synchronously.
(Note: this resource was added to OER Commons as part of a batch upload of over 2,200 records. If you notice an issue with the quality of the metadata, please let us know by using the 'report' button and we will flag it for consideration.)
In this activity, students model the impact of land-cover changes on stormwater …
In this activity, students model the impact of land-cover changes on stormwater runoff using the EPA's National Stormwater Calculator (Calculator). The students are introduced to the Calculator through a tutorial. Students are provided with a particular site -- a residential neighborhood -- and model two land-use scenarios associated with it: (1) a pre-expansion scenario that includes current forest and developed land cover, and (2) a post-expansion scenario, under which the forest cover will be developed as low-intensity residential.
(Note: this resource was added to OER Commons as part of a batch upload of over 2,200 records. If you notice an issue with the quality of the metadata, please let us know by using the 'report' button and we will flag it for consideration.)
In this activity, students model the impact of changes in land cover …
In this activity, students model the impact of changes in land cover on stormwater runoff using the EPA's National Stormwater Calculator. Students mitigate increased stormwater runoff resulting from development with low impact development (LID) controls. Students assess the LID controls in terms of the ecosystem services that they are intended to replace and discuss alternative development designs to reduce the need for them.
(Note: this resource was added to OER Commons as part of a batch upload of over 2,200 records. If you notice an issue with the quality of the metadata, please let us know by using the 'report' button and we will flag it for consideration.)
In this activity, students model the impact of a proposed land-use change …
In this activity, students model the impact of a proposed land-use change for a local site using the EPA's National Stormwater Calculator (Calculator). Given a description of the proposed land-use change, students devise and execute a series of simulations in the Calculator that model its potential impact on stormwater retention. Using additional simulations, students explore changes to the site that utilize low impact development (LID) controls to mitigate stormwater runoff.
(Note: this resource was added to OER Commons as part of a batch upload of over 2,200 records. If you notice an issue with the quality of the metadata, please let us know by using the 'report' button and we will flag it for consideration.)
Electrical measurement of unconsolidated soils in the laboratory. Provenance: Lee Slater, Rutgers …
Electrical measurement of unconsolidated soils in the laboratory.
Provenance: Lee Slater, Rutgers University-Newark Reuse: This item is in the public domain and maybe reused freely without restriction. Archie (1950) defined the term petrophysics to describe the study of the physics of rocks, particularly with respect to the fluids they contain. Although originally focused on geophysical exploration, petrophysics concepts are now used to interpret near surface geophysics measurements made to address environmental and engineering problems. This unit investigates relationships between these geophysical measurements and the physical and chemical properties of soils and sediments in the Earth's near subsurface. The specific focus is on the electrical properties of soils and how they are related to the ionic concentration of the pore fluids, the water content, porosity and grain size. Field results from a geophysical survey performed in Kearny Marsh, close to Harrier Meadow, are included to illustrate how electrical conductivity of a soil measured with an electromagnetic sensor is a good proxy for pore fluid ionic concentration, in this case related to contamination from a bordering landfill.
(Note: this resource was added to OER Commons as part of a batch upload of over 2,200 records. If you notice an issue with the quality of the metadata, please let us know by using the 'report' button and we will flag it for consideration.)
In Unit 2, students learn how the techniques for water budgeting (covered …
In Unit 2, students learn how the techniques for water budgeting (covered in Unit 1) can be used to monitor both groundwater (High Plains Aquifer) and surface water (western mountain watershed) systems. Students interpret time-series plots that show the impact of drought years and wet years on underground water storage in the High Plains Aquifer and on snowpack and surface runoff in the western mountain watershed. They also consider the societal implications of water deficits through a series of pre-class readings, questions embedded in the assignments, and small and whole-group discussions. This unit can involve substantial computer time during which students use Excel to view and interpret hydrologic data. An alternative version with hard-copy graphs is also provided.
Show more about Online Teaching suggestions Hide Online-adaptable: Both parts of this unit are completely digital and thus at a logistical level it can be switched to online fairly easily. However, due to the relative complexity of the data investigations, there will still be quite a bit of instructor support needed and/or extended small group that should be arranged.
(Note: this resource was added to OER Commons as part of a batch upload of over 2,200 records. If you notice an issue with the quality of the metadata, please let us know by using the 'report' button and we will flag it for consideration.)
No restrictions on your remixing, redistributing, or making derivative works. Give credit to the author, as required.
Your remixing, redistributing, or making derivatives works comes with some restrictions, including how it is shared.
Your redistributing comes with some restrictions. Do not remix or make derivative works.
Most restrictive license type. Prohibits most uses, sharing, and any changes.
Copyrighted materials, available under Fair Use and the TEACH Act for US-based educators, or other custom arrangements. Go to the resource provider to see their individual restrictions.