Even when we model the dynamics of the abundances of molecules inside …
Even when we model the dynamics of the abundances of molecules inside biological systems using calculus, it is important to remember that underlying behavior can be apparently random ("stochastic"). Even a deterministic system containing components moving in periodic ways can, at early times, support dynamics that appear disordered. The behavior of systems containing complicated collections of interacting parts can be difficult to predict with accuracy (chaos). Finally, systems can display stochasticity because the outcomes of measurements on quantum systems are indeterminate in a fundamental way. Random processes are modeled using Markov models.
In this lesson, you will administer a Benchmark Assessment (Cold Write) to …
In this lesson, you will administer a Benchmark Assessment (Cold Write) to determine what students already know about argument writing. Students will respond to a prompt, and then you will assess each student’s argument, using the scoring guide, as a measure of early work. Students will have opportunities to write arguments throughout the year, during which they will have instruction on how to revise and edit their pieces. The information you gain from scoring this benchmark piece of writing will guide you in tailoring your writing instruction to individual student needs.
The precursors to what we study today as Trigonometry had their origin …
The precursors to what we study today as Trigonometry had their origin in ancient Mesopotamia, Greece and India. These cultures used the concepts of angles and lengths as an aid to understanding the movements of the heavenly bodies in the night sky. Ancient trigonometry typically used angles and triangles that were embedded in circles so that many of the calculations used were based on the lengths of chords within a circle. The relationships between the lengths of the chords and other lines drawn within a circle and the measure of the corresponding central angle represent the foundation of trigonometry - the relationship between angles and distances.
This multi-week project begins with a measurement of baseline consumptive behavior followed …
This multi-week project begins with a measurement of baseline consumptive behavior followed by three weeks of working to reduce the use of water, energy, high-impact foods, and other materials. The assignment uses an Excel spreadsheet that calculates direct energy and water use as well as indirect CO2 and water use associated with food consumption. After completing the project, students understand that they do indeed play a role in the big picture. They also learn that making small changes to their lifestyles is not difficult and they can easily reduce their personal impact on the environment.
When we look at the night sky, we see stars and the …
When we look at the night sky, we see stars and the nearby planets of our own solar system. Many of those stars are actually distant galaxies and glowing clouds of dust and gases called nebulae. The universe is an immense space with distances measured in light years. The more we learn about the universe beyond our solar system, the more we realize we do not know. Students are introduced to the basic known facts about the universe, and how engineers help us explore the many mysteries of space.
Freebookcentre.net's computer science section contains links to many technical books offered free …
Freebookcentre.net's computer science section contains links to many technical books offered free online, either as html pages or downloadable pdfs. Books are arranged by subject: Data Structures and Algorithms, Compiler Design, Object Oriented Programming, Operating Systems, Computation Theory, Artificial Intelligence, and others.
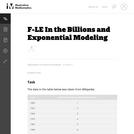
This problem provides an opportunity to experiment with modeling real data. Populations …
This problem provides an opportunity to experiment with modeling real data. Populations are often modeled with exponential functions and in this particular case we see that, over the last 200 years, the rate of population growth accelerated rapidly, reaching a peak a little after the middle of the 20th century and now it is slowing down.
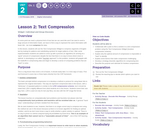
At some point we reach a physical limit of how fast we …
At some point we reach a physical limit of how fast we can send bits and if we want to send a large amount of information faster, we have to find a way to represent the same information with fewer bits - we must **compress** the data.
In this lesson, students will use the Text Compression Widget to compress segments of English text by looking for patterns and substituting symbols for larger patterns of text. After some experimentation students are asked to come up with a process (or algorithm) for arriving at a "good" amount of compression despite the fact that there is no way to know what is best or optimal. In developing a so-called "[v heuristic] approach" to this problem, students will grapple with the tradeoffs in compressing data and begin to develop a sense of computing problems that are “hard” to solve.
This exercise is done in a computer lab using ESRI ArcMap software …
This exercise is done in a computer lab using ESRI ArcMap software with both the Spatial Analyst and 3D Analyst extensions. Students are given a copy of the Lakeside Nebraska 15 minute topographic map and a shapefile containing all the lake elevation data. They are given instructions on how to rasterize the point data to create a contour map of the water table surface and are then shown how to create flow lines. Their task is to create a flow net that they will use to determine areas of groundwater recharge and discharge. They will then generate hypotheses to explain what controls the groundwater flow system in this area.
(Note: this resource was added to OER Commons as part of a batch upload of over 2,200 records. If you notice an issue with the quality of the metadata, please let us know by using the 'report' button and we will flag it for consideration.)
Short Description: The content of this textbook is aligned with the British …
Short Description: The content of this textbook is aligned with the British Columbia Adult Basic Education learning outcomes for the Advanced Level Business/Technical Mathematics. The textbook covers nine groups of learning outcomes organized in chapters. The first three chapters cover the core learning outcomes: 1. Operations with Real Numbers 2. First Degree Equations and Inequalities 3. Equations and their Graphs The remaining chapters cover the following six topics:4.Systems of Equations 5. Trigonometry 6. Health Option 7. Finance 8. Data Analysis1 9. Data Analysis2.
Word Count: 137600
ISBN: 978-1-77420-126-8
(Note: This resource's metadata has been created automatically by reformatting and/or combining the information that the author initially provided as part of a bulk import process.)
In this introductory-level lab activity, students first view a 20-minute portion of …
In this introductory-level lab activity, students first view a 20-minute portion of an informative video to learn about the operation of an array of moored buoys that is used to detect changes in the El NiÃo Southern Oscillation (El NiÃo, "normal", and La NiÃa conditions)in the equatorial Pacific Ocean. Students then directly access, display, and work with recent and present data collected from the buoy system using the Tropical Atmosphere Ocean project website. Finally, students examine data from a coral geochemical record to infer past ENSO events.
(Note: this resource was added to OER Commons as part of a batch upload of over 2,200 records. If you notice an issue with the quality of the metadata, please let us know by using the 'report' button and we will flag it for consideration.)
Think about the many sets of data you may encounter in your …
Think about the many sets of data you may encounter in your daily activities. You may track your finances, follow statistics for your favorite sport, watch stock market trends, or pay attention to weather records such as temperature and precipitation. News reports often include graphs that you must understand in order to follow an argument. And of course, scientists use graphs to summarize and convey information and to support hypotheses. Before the days of computers, people had to record data and perform calculations by hand. In fact, the original use of the word "computer" was to describe a person whose job was doing arithmetic. At that time, a spreadsheet was a piece of paper with ruled lines forming rows and columns where data could be written in. Today, most people use computer spreadsheets in the form of software such as Microsoft Excel -- , but the basic idea remains the same. Student materials for this exercise include a Microsoft Excel spreadsheet with marked cells and several charts and the instruction sheet (MS Word). The exercise is divided into three parts. Part I introduces the capability of a spreadsheet to handle a large dataset containing worldwide earthquake epicenters from October 2011 and plots a scatter chart of these data, which is equivalent to a map. In Part II, students work with several different types of charts (column, bar, pie, and triangle charts) and use tables and charts to answer questions about Earth's interior. Part III involves entering a formula using cell names, learning to fill down, and discovering how relative and absolute cell names work. This work is done in the context of Earth's interior layers.
(Note: this resource was added to OER Commons as part of a batch upload of over 2,200 records. If you notice an issue with the quality of the metadata, please let us know by using the 'report' button and we will flag it for consideration.)
Students will be introduced to the 4 basic functions that computers perform …
Students will be introduced to the 4 basic functions that computers perform and begin to think about the advantages that computers have over humans in taking in input, processing data, and providing output. Students will be asked to identify how humans interface with computers using input and output devices and then invent a new input/output prototype of their choosing.
Broadly speaking, Machine Learning refers to the automated identification of patterns in …
Broadly speaking, Machine Learning refers to the automated identification of patterns in data. As such it has been a fertile ground for new statistical and algorithmic developments. The purpose of this course is to provide a mathematically rigorous introduction to these developments with emphasis on methods and their analysis. You can read more about Prof. Rigollet’s work and courses on his website.
Using her countywide program as an example, a recycling educator offers incentives …
Using her countywide program as an example, a recycling educator offers incentives for recycling by providing data on energy savings and explaining how her county in Michigan supports the program. The Climate Kids website is a NASA education resource featuring articles, videos, images and games focused on the science of climate change.
Does it feel like your dollars go as far as they used …
Does it feel like your dollars go as far as they used to? If not, how does that mesh when reports say inflation rates are lower than average? The October 2015 issue of Page One Economics explains the disconnect between what you might experience as a consumer and what the data show.
This interactive and collaborative activity asks students to first react to price …
This interactive and collaborative activity asks students to first react to price changes and then analyze the results. Instructors can upload the materials to their own Google drives and run the experiment repeatedly to generate new data and demonstrate trends. This resource was developed by Birjees Ashraf, Sophie Haci, Renee Edwards, and Charles Hackner.
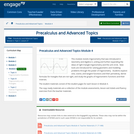
This module revisits trigonometry that was introduced in Geometry and Algebra II, …
This module revisits trigonometry that was introduced in Geometry and Algebra II, uniting and further expanding the ideas of right triangle trigonometry and the unit circle. New tools are introduced for solving geometric and modeling problems through the power of trigonometry. Students explore sine, cosine, and tangent functions and their periodicity, derive formulas for triangles that are not right, and study the graphs of trigonometric functions and their inverses.
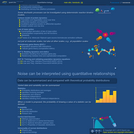
Students analyze the graph of a proportional relationship in order to find …
Students analyze the graph of a proportional relationship in order to find the approximate constant of proportionality, to write the related formula, and to create a table of values that lie on the graph.Key ConceptsThe constant of proportionality determines the steepness of the straight-line graph that represents a proportional relationship. The steeper the line is, the greater the constant of proportionality.On the graph of a proportional relationship, the constant of proportionality is the constant ratio of y to x, or the slope of the line.A proportional relationship can be represented in different ways: a ratio table, a graph of a straight line through the origin, or an equation of the form y = kx, where k is the constant of proportionality.Goals and Learning ObjectivesIdentify the constant of proportionality from a graph that represents a proportional relationship.Write a formula for a graph that represents a proportional relationship.Make a table for a graph that represents a proportional relationship.Relate the constant of proportionality to the steepness of a graph that represents a proportional relationship (i.e., the steeper the line is, the greater the constant of proportionality).
No restrictions on your remixing, redistributing, or making derivative works. Give credit to the author, as required.
Your remixing, redistributing, or making derivatives works comes with some restrictions, including how it is shared.
Your redistributing comes with some restrictions. Do not remix or make derivative works.
Most restrictive license type. Prohibits most uses, sharing, and any changes.
Copyrighted materials, available under Fair Use and the TEACH Act for US-based educators, or other custom arrangements. Go to the resource provider to see their individual restrictions.