A quiz is a form of mind spot attempt to answer questions correctly. It is …
A quiz is a form of mind spot attempt to answer questions correctly. It is a game to test knowledge about a certain subject. In some countries, a quiz is also a brief assesment used in education and similar fields to measure growth in knowledge, abilities and skills. This Assessment is based on multiple choice questions for all competitive exams. We are providing you different MCQs on different topics of Indian Economy so that you can check your knowledge on different topics related to Indian Economy.
As schools close their doors as part of public health measures to …
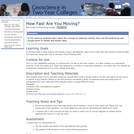
As schools close their doors as part of public health measures to limit the spread of COVID-19, educators are faced with how to support the diverse needs of all learners when students are not in school. This guide recognizes that solutions will not be – nor should be – “school as usual,” simply delivered in a virtual environment. Instead, this resource was developed by members of the Council of State Science Supervisors to provide guidance around how to support student science learning during these unique circumstances. Image by April Bryant from Pixabay
Affective domain assessment focuses on evaluating the attitudes, values, beliefs, and emotions …
Affective domain assessment focuses on evaluating the attitudes, values, beliefs, and emotions of students. It assesses the affective aspects of learning, such as motivation, engagement, interpersonal skills, empathy, and ethical awareness. This type of assessment aims to measure the development of students' attitudes and values, and their ability to apply them in various contexts. It often involves self-assessment, peer evaluation, and observations to gauge students' emotional and social growth. Affective domain assessment recognizes the importance of nurturing well-rounded individuals by assessing their emotional intelligence and their ability to interact effectively with others.AFFECTIVE_DOMAIN_ASSESSMENT.docx
Even when we model the dynamics of the abundances of molecules inside …
Even when we model the dynamics of the abundances of molecules inside biological systems using calculus, it is important to remember that underlying behavior can be apparently random ("stochastic"). Even a deterministic system containing components moving in periodic ways can, at early times, support dynamics that appear disordered. The behavior of systems containing complicated collections of interacting parts can be difficult to predict with accuracy (chaos). Finally, systems can display stochasticity because the outcomes of measurements on quantum systems are indeterminate in a fundamental way. Random processes are modeled using Markov models.
Think about the many sets of data you may encounter in your …
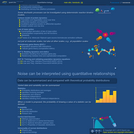
Think about the many sets of data you may encounter in your daily activities. You may track your finances, follow statistics for your favorite sport, watch stock market trends, or pay attention to weather records such as temperature and precipitation. News reports often include graphs that you must understand in order to follow an argument. And of course, scientists use graphs to summarize and convey information and to support hypotheses. Before the days of computers, people had to record data and perform calculations by hand. In fact, the original use of the word "computer" was to describe a person whose job was doing arithmetic. At that time, a spreadsheet was a piece of paper with ruled lines forming rows and columns where data could be written in. Today, most people use computer spreadsheets in the form of software such as Microsoft Excel -- , but the basic idea remains the same. Student materials for this exercise include a Microsoft Excel spreadsheet with marked cells and several charts and the instruction sheet (MS Word). The exercise is divided into three parts. Part I introduces the capability of a spreadsheet to handle a large dataset containing worldwide earthquake epicenters from October 2011 and plots a scatter chart of these data, which is equivalent to a map. In Part II, students work with several different types of charts (column, bar, pie, and triangle charts) and use tables and charts to answer questions about Earth's interior. Part III involves entering a formula using cell names, learning to fill down, and discovering how relative and absolute cell names work. This work is done in the context of Earth's interior layers.
(Note: this resource was added to OER Commons as part of a batch upload of over 2,200 records. If you notice an issue with the quality of the metadata, please let us know by using the 'report' button and we will flag it for consideration.)
An exercise on rotational velocity that helps develop critical thinking and data …
An exercise on rotational velocity that helps develop critical thinking and data analysis and presentation skills.
(Note: this resource was added to OER Commons as part of a batch upload of over 2,200 records. If you notice an issue with the quality of the metadata, please let us know by using the 'report' button and we will flag it for consideration.)
Teacher guide and tutorial for accessing data using the Quake Catcher Network …
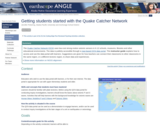
Teacher guide and tutorial for accessing data using the Quake Catcher Network (QCN) portal.
(Note: this resource was added to OER Commons as part of a batch upload of over 2,200 records. If you notice an issue with the quality of the metadata, please let us know by using the 'report' button and we will flag it for consideration.)
The relationship between the stress and strain that a particular material displays …
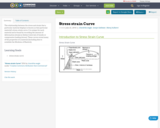
The relationship between the stress and strain that a particular material displays is known as that particular material's stress–strain curve. It is unique for each material and is found by recording the amount of deformation (strain) at distinct intervals of tensile or compressive loading (stress). These curves reveal many of the properties of a material (including data to establish the Modulus of Elasticity
Students are asked to present a speech at the opening of the …
Students are asked to present a speech at the opening of the River and Ocean Film Festival, explaining why marine debris is such a problem for wildlife. Use information from the video, the fact sheet, the infographic, and the data collected on the shoreline to outline a speech. The audience is visitors to the Washington Coast. Includes Teacher directions and scoring notes.
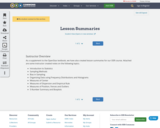
As a supplement to the OpenStax textbook, we have also created lesson …
As a supplement to the OpenStax textbook, we have also created lesson summaries for our OER course. Attached are some instructor created notes on the following topics.Introduction to StatisticsSampling MethodsBias in SamplingOrganizing Data using Frequency Distributions and HistogramsMeasures of CenterMeasures of Dispersion and Empirical RuleMeasures of Position, Fences and Outliers5-Number Summary and Boxplots
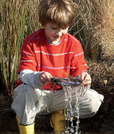
This interactive and collaborative activity asks students to estimate the demand of …
This interactive and collaborative activity asks students to estimate the demand of a product (pizza) based on different prices. Instructors can upload the materials to their own Google drives and run the experiment repeatedly to generate new data and demonstrate trends. This resource was developed by Birjees Ashraf, Sophie Haci, Renee Edwards, and Charles Hackner.
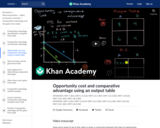
In this video, we use the PPCs for two different countries that …
In this video, we use the PPCs for two different countries that each produce two goods in order to create an output table based on the data in the graph. We then use the output table to determine the opportunity costs of producing each good. Finally, we determine which country has a comparative advantage in each good.
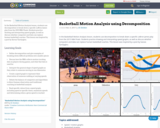
In the Basketball Motion Analysis lesson, students use decomposition to break down …
In the Basketball Motion Analysis lesson, students use decomposition to break down a specific LeBron James play from the 2015 NBA Finals. Students practice drawing and interpreting speed graphs, as well as discuss whether computers and data can replace human basketball coaches. This lesson was inspired by a post by Savvas Tjortjoglou.
This video from ClimateCentral looks at the way climate conditions can affect …
This video from ClimateCentral looks at the way climate conditions can affect vegetation in the West, and what influence this has on wildfires. Drought and rainfall can have very different wildfire outcomes, depending on vegetation type, extent, and location.
This quick tour provides a brief introduction to Ensembl Genomes, the non-chordate …
This quick tour provides a brief introduction to Ensembl Genomes, the non-chordate genome browser.
By the end of the course you will be able to: Describe what Ensembl Genomes is and how it can help you to access and analyse genome-scale data Recall where to find out more about the Ensembl Genomes resource
Students learn about parallax in this Moveable Museum unit, in which they …
Students learn about parallax in this Moveable Museum unit, in which they use mathematical techniques related to parallax to calculate the height of an object. The eight-page PDF guide includes suggested general background readings for educators, activity notes, step-by-step directions, a Data Sheet and a Tangent Table, and an astrolabe template.
Examination of experimental design as applied to nutrition research, including intervention, observational, …
Examination of experimental design as applied to nutrition research, including intervention, observational, survey, and animal models. Development of research topics; methods of data collection; interpretation and presentation of results; ethical considerations; application of principles for development of research proposals and evaluation of the nutrition literature. (Prerequisites: advanced coursework in Nutrition and a course in Biostatistics)
This module revisits trigonometry that was introduced in Geometry and Algebra II, …
This module revisits trigonometry that was introduced in Geometry and Algebra II, uniting and further expanding the ideas of right triangle trigonometry and the unit circle. New tools are introduced for solving geometric and modeling problems through the power of trigonometry. Students explore sine, cosine, and tangent functions and their periodicity, derive formulas for triangles that are not right, and study the graphs of trigonometric functions and their inverses.
Students analyze the graph of a proportional relationship in order to find …
Students analyze the graph of a proportional relationship in order to find the approximate constant of proportionality, to write the related formula, and to create a table of values that lie on the graph.Key ConceptsThe constant of proportionality determines the steepness of the straight-line graph that represents a proportional relationship. The steeper the line is, the greater the constant of proportionality.On the graph of a proportional relationship, the constant of proportionality is the constant ratio of y to x, or the slope of the line.A proportional relationship can be represented in different ways: a ratio table, a graph of a straight line through the origin, or an equation of the form y = kx, where k is the constant of proportionality.Goals and Learning ObjectivesIdentify the constant of proportionality from a graph that represents a proportional relationship.Write a formula for a graph that represents a proportional relationship.Make a table for a graph that represents a proportional relationship.Relate the constant of proportionality to the steepness of a graph that represents a proportional relationship (i.e., the steeper the line is, the greater the constant of proportionality).
No restrictions on your remixing, redistributing, or making derivative works. Give credit to the author, as required.
Your remixing, redistributing, or making derivatives works comes with some restrictions, including how it is shared.
Your redistributing comes with some restrictions. Do not remix or make derivative works.
Most restrictive license type. Prohibits most uses, sharing, and any changes.
Copyrighted materials, available under Fair Use and the TEACH Act for US-based educators, or other custom arrangements. Go to the resource provider to see their individual restrictions.