This is a simulation to explore how climate change will affect a …
This is a simulation to explore how climate change will affect a specific region in the coming decades. Graphs and maps in The Climate Explorer help students understand past, present, and future climate projections for their location.
This simulation allows the user to project CO2 sources and sinks by …
This simulation allows the user to project CO2 sources and sinks by adjusting the points on a graph and then running the simulation to see projections for the impact on atmospheric CO2 and global temperatures.
How might Earth's temperature change in the future? Use this model to …
How might Earth's temperature change in the future? Use this model to explore how changing human emissions of greenhouse gases might affect the temperature. The model incorporates positive and negative feedback loops. Ice cover and cloud cover change in response to the level of water vapor and temperature in the model.
For the first time in history, the global demand for freshwater is …
For the first time in history, the global demand for freshwater is overtaking its supply in many parts of the world. The U.N. predicts that by 2025, more than half of the countries in the world will be experiencing water stress or outright shortages. Lack of water can cause disease, food shortages, starvation, migrations, political conflict, and even lead to war. Models of cooperation, both historic and contemporary, show the way forward. The first half of the course details the multiple facets of the water crisis. Topics include water systems, water transfers, dams, pollution, climate change, scarcity, water conflict/cooperation, food security, and agriculture. The second half of the course describes innovative solutions: Adaptive technologies and adaptation through policy, planning, management, economic tools, and finally, human behaviors required to preserve this precious and imperiled resource. Several field trips to water/wastewater/biosolids reuse and water-energy sites will help us to better comprehend both local and international challenges and solutions.
This course will explore innovations in information systems for health care delivery …
This course will explore innovations in information systems for health care delivery in developing countries, and focus not only on the importance of technology, but also on broader issues necessary for its success, such as quality improvement, project management, and leadership skills. This course is targeted toward individuals interested in designing or implementing a health information and communication technology (ICT) solution in the developing world. Implementing a health information technology project requires multidisciplinary teams. Thus, with this course, we hope to bring together individuals from a variety of disciplines—computer science, medicine, engineering, public health, policy, and business. What you’ll learn:
Global health burden Design thinking Health informatics Software development process Evaluation and monitoring
This course is part of the Open Learning Library, which is free to use. You have the option to sign up and enroll in the course if you want to track your progress, or you can view and use all the materials without enrolling.
With this simulation from the NASA Climate website, learners explore different examples …
With this simulation from the NASA Climate website, learners explore different examples of how ice is melting due to climate change in four places where large quantities of ice are found. The photo comparisons, graphs, animations, and especially the time lapse video clips of glaciers receding are astonishing and dramatic.
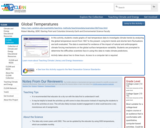
In this activity, students create graphs of real temperature data to investigate …
In this activity, students create graphs of real temperature data to investigate climate trends by analyzing the global temperature record from 1867 to the present. Long-term trends and shorter-term fluctuations are both evaluated. The data is examined for evidence of the impact of natural and anthropogenic climate forcing mechanisms on the global surface temperature variability. Students are prompted to determine the difficulties scientists face in using this data to make climate predictions.
This is a teaching module, directed to undergraduate students in applied mathematics, …
This is a teaching module, directed to undergraduate students in applied mathematics, that presents a Zonal Energy Balance Model to describe the evolution of the latitudinal distribution of Earth's surface temperature subject to incremental levels of cumulative carbon emissions in the atmosphere. A strategy to avert "dangerous levels" of global warming is imbedded in the model. Students working with the module will write a computer code, using a software such as MATLAB or Mathematica, to obtain numerical solutions of the model and simulate strategies that guarantee controlled levels of global warming.
In this assignment, you will conduct an experiment to simulate the greenhouse …
In this assignment, you will conduct an experiment to simulate the greenhouse effect and global warming. You will be recording and graphing your results.
This course introduces the basic science underpinning our knowledge of the climate …
This course introduces the basic science underpinning our knowledge of the climate system, how climate has changed in the past, and how it may change in the future. The course focuses on the fundamental energy balance between incoming solar radiation and outgoing infrared radiation in the climate system, and how this balance is affected by greenhouse gases. We will also discuss physical processes that shape the climate, such as atmospheric and oceanic convection and large-scale circulation, solar variability, orbital mechanics, and aerosols, as well as the evidence for past and present climate change. We will discuss climate models of varying degrees of complexity, and you will be able to run a model of a single column of the Earth’s atmosphere to simulate many of the important elements of climate change. This course is part of the Open Learning Library, which is free to use. You have the option to sign up and enroll in the course if you want to track your progress, or you can view and use all the materials without enrolling.
Scientists say the planet is warming because of human activities, namely the …
Scientists say the planet is warming because of human activities, namely the greenhouse effect from carbon dioxide released to the atmosphere when burning fossil fuels. But, how do we know? How do scientists know? Students are presented with the following questions: 1) What makes a greenhouse gas a greenhouse gas? 2) Is carbon dioxide a greenhouse gas? [Instructor: How do we know?] 3) Is the amount of carbon dioxide in the atmosphere increasing? How do we know? 4) Is carbon dioxide [in the atmosphere] increasing because of human activities? [Instructor: How do we know?] ---- Discussion of results and prediction of what students expect will happen to global average temperature... 5) Is global average temperature increasing? How do we know?
Separate groups of students research just one question each on the internet and submit a brief summary to the instructor. The instructor and class go over results for just the first four questions. The instructor addresses "How do we know" for questions 2 and 4. Then, students are asked what they think will happen to global average temperature based on results of the first four questions (i.e. make an hypothesis). Finally, the results from the last group are presented and students are asked to discuss how observed global temperature changes compare with their hypothesis.
(Note: this resource was added to OER Commons as part of a batch upload of over 2,200 records. If you notice an issue with the quality of the metadata, please let us know by using the 'report' button and we will flag it for consideration.)
This animation shows predicted changes in temperature across the globe, relative to …
This animation shows predicted changes in temperature across the globe, relative to pre-industrial levels, under two different emissions scenarios in the COP 17 climate model. The first is with emissions continuing to increase through the century. The second is with emissions declining through the century.
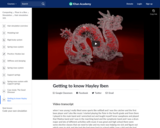
This resource is a video abstract of a research paper created by …
This resource is a video abstract of a research paper created by Research Square on behalf of its authors. It provides a synopsis that's easy to understand, and can be used to introduce the topics it covers to students, researchers, and the general public. The video's transcript is also provided in full, with a portion provided below for preview:
"Known as the “Roof of Africa”, the highlands of Ethiopia are a lofty oasis. Though situated near the equator, the region enjoys cool temperatures year-round thanks to its high elevation—about 1200 meters above sea level. But a changing climate could change that over the next century. Researchers at MIT project that towards the end of the 21st century the Ethiopian highlands in East Africa will be at a significantly high risk for transmitting malaria, transforming this temperate haven into a breeding ground for disease. The work follows up on the team’s previous research on West Africa. There, the researchers acknowledged, malaria currently poses a big threat. A combination of high rainfall and warm temperatures create the ideal conditions for mosquitos to breed and spread disease..."
The rest of the transcript, along with a link to the research itself, is available on the resource itself.
Student teams learn about engineering design of green fluorescent proteins (GFPs) and …
Student teams learn about engineering design of green fluorescent proteins (GFPs) and their use in medical research, including stem cell research. They simulate the use of GFPs by adding fluorescent dye to water and letting a flower or plant to transport the dye throughout its structure. Students apply their knowledge of GFPs to engineering applications in the medical, environmental and space exploration fields. Due to the fluorescing nature of the dye, plant life of any color, light or dark, can be used unlike dyes that can only be seen in visible light.
Students engage in an activity that matches programs for low-income people with …
Students engage in an activity that matches programs for low-income people with the type of economic inequity the program addresses and observe an activity simulating tax payments and transfers.
Portland Public Schools has developed this unit. Their hope is that ALL …
Portland Public Schools has developed this unit. Their hope is that ALL K-5 students will be able to access rigorous, standards-aligned science instruction that engages them in hands-on experiences and sense-making through student discourse. They want to encourage all students to be critical thinkers and lifelong learners. To that end, the science and ESL departments at Portland Public Schools, in consultation with NGSS writer Rita Januszyk, have developed units that are aligned with both Next Generation Science Standards and Oregon’s English Language Proficiency standards.
In this unit, students observe patterns of the sun, moon, and stars in the sky and learn that patterns in data can be used to make predictions. Students also relate the amount of sunlight to seasons, and lengths of day and night.
In this 20-day module students explore area as an attribute of two-dimensional …
In this 20-day module students explore area as an attribute of two-dimensional figures and relate it to their prior understandings of multiplication. Students conceptualize area as the amount of two-dimensional surface that is contained within a plane figure. They come to understand that the space can be tiled with unit squares without gaps or overlaps. They make predictions and explore which rectangles cover the most area when the side lengths differ. Students progress from using square tile manipulatives to drawing their own area models and manipulate rectangular arrays to concretely demonstrate the arithmetic properties. The module culminates with students designing a simple floor plan that conforms to given area specifications.
Find the rest of the EngageNY Mathematics resources at https://archive.org/details/engageny-mathematics.
No restrictions on your remixing, redistributing, or making derivative works. Give credit to the author, as required.
Your remixing, redistributing, or making derivatives works comes with some restrictions, including how it is shared.
Your redistributing comes with some restrictions. Do not remix or make derivative works.
Most restrictive license type. Prohibits most uses, sharing, and any changes.
Copyrighted materials, available under Fair Use and the TEACH Act for US-based educators, or other custom arrangements. Go to the resource provider to see their individual restrictions.