Updating search results...

Search Resources

2822 Results

View
Selected filters:
D-Lab II: Design
Conditional Remix & Share Permitted
CC BY-NC-SA
Rating
0.0 stars

D-Lab: Design addresses problems faced by undeserved communities with a focus on design, experimentation, and prototyping processes. Particular attention is placed on constraints faced when designing for developing countries. Multidisciplinary teams work on semester-long projects in collaboration with community partners, field practitioners, and experts in relevant fields. Topics covered include design for affordability, design for manufacture, sustainability, and strategies for working effectively with community partners and customers. Students may continue projects begun in EC.701J D-Lab I: Development.

Subject:
Applied Science
Engineering
Environmental Science
Material Type:
Full Course
Date Added:
07/14/2022
D-Lab: Supply Chains
Conditional Remix & Share Permitted
CC BY-NC-SA
Rating
0.0 stars

This course introduces concepts of supply chain design and operations with a focus on supply chains for products destined to improve quality of life in developing countries. Topics include demand estimation, capacity planning and process analysis, inventory management, and supply chain coordination and performance. We also cover issues specific to emerging markets, such as sustainable supply chains, how to couple product design with supply chain design and operation, and how to account for the value-adding role of a supply chain. A major aspect of class is the student projects on supply chain design or improvement.

Subject:
Applied Science
Engineering
Environmental Science
Material Type:
Full Course
Date Added:
07/14/2022
D-Lab: Water, Climate Change, and Health
Conditional Remix & Share Permitted
CC BY-NC-SA
Rating
0.0 stars

D-Lab: Water, Climate Change, and Health is a project-based, experiential, and transdisciplinary course. Together with peers and experts, we will explore the vitally important interface of water, climate change, and health. This course addresses mitigation and adaptation to climate change as it pertains to water and health. Water-borne illness, malnutrition, and vector-borne diseases represent the top three causes of morbidity and mortality in regions of our focus. Students submit a term project, setting the stage for a lifelong commitment to communicating climate science to a broad public.

Subject:
Applied Science
Environmental Science
Material Type:
Full Course
Provider:
MIT
Author:
Juliet Simpson
Susan Murcott
Date Added:
06/06/2022
D-Lab: Water, Climate Change, and Health
Conditional Remix & Share Permitted
CC BY-NC-SA
Rating
0.0 stars

D-Lab: Water, Climate Change, and Health is a project-based, experiential, and transdisciplinary course. Together with peers and experts, we will explore the vitally important interface of water, climate change, and health. This course addresses mitigation and adaptation to climate change as it pertains to water and health. Water-borne illness, malnutrition, and vector-borne diseases represent the top three causes of morbidity and mortality in regions of our focus. Students submit a term project, setting the stage for a lifelong commitment to communicating climate science to a broad public.

Subject:
Applied Science
Atmospheric Science
Environmental Science
Health, Medicine and Nursing
Physical Science
Material Type:
Full Course
Provider:
MIT
Provider Set:
MIT OpenCourseWare
Author:
Murcott, Susan
Simpson, Juliet
Date Added:
02/01/2019
D-Lab: Water, Sanitation, and Hygiene
Conditional Remix & Share Permitted
CC BY-NC-SA
Rating
0.0 stars

This course focuses on disseminating Water, Sanitation and Hygiene (WASH) or water/environment innovations in developing countries and underserved communities worldwide. It emphasizes core WASH and water/environment principles, culture-specific solutions, tools for start-ups, appropriate and sustainable technologies, behavior change, social marketing, building partnerships, and the theory and practice of innovation diffusion.

Subject:
Applied Science
Engineering
Environmental Science
Material Type:
Full Course
Date Added:
07/14/2022
Daily Weather Record Breakers
Read the Fine Print
Rating
0.0 stars

This tool provides a summary of daily records broken in several weather parameters (temperature, precipitation, snow fall, snow depth), over various time intervals, in the US and globally.

Subject:
Career and Technical Education
Environmental Studies
Physical Science
Provider:
CLEAN: Climate Literacy and Energy Awareness Network
Provider Set:
CLEAN: Climate Literacy and Energy Awareness Network
Author:
NOAA
Date Added:
09/24/2018
Daisyworld: Interactive On-line PC and Mac
Conditional Remix & Share Permitted
CC BY-NC-SA
Rating
0.0 stars

Students use a JAVA interface design by R.M. MacKay to explore the Daisy World model. The JAVA interface comes with a link to a 6-page student activity page in PDF format.

(Note: this resource was added to OER Commons as part of a batch upload of over 2,200 records. If you notice an issue with the quality of the metadata, please let us know by using the 'report' button and we will flag it for consideration.)

Subject:
Applied Science
Biology
Chemistry
Environmental Science
Life Science
Mathematics
Physical Science
Statistics and Probability
Material Type:
Activity/Lab
Provider:
Science Education Resource Center (SERC) at Carleton College
Provider Set:
Teach the Earth
Author:
Bob Mackay
Mike Clark
Date Added:
09/29/2022
Daisyworld: Stella Mac or PC
Conditional Remix & Share Permitted
CC BY-NC-SA
Rating
0.0 stars

After constructing a Stella model of Daisyworld students perform guided experiments to explore the behavior of Daisyworld to changes in model parameters and assumptions.

(Note: this resource was added to OER Commons as part of a batch upload of over 2,200 records. If you notice an issue with the quality of the metadata, please let us know by using the 'report' button and we will flag it for consideration.)

Subject:
Applied Science
Biology
Environmental Science
Life Science
Mathematics
Statistics and Probability
Material Type:
Activity/Lab
Provider:
Science Education Resource Center (SERC) at Carleton College
Provider Set:
Teach the Earth
Author:
Mike Clark
Date Added:
09/29/2022
Daisyworld - This World is Black and White
Read the Fine Print
Rating
0.0 stars

This short, engaging video created by NASA presents a complex topic via a simple analogy. The idea of positive and negative feedback is demonstrated by Daisyworld - a world with black and white flowers growing on it.

Subject:
Applied Science
Career and Technical Education
Environmental Science
Environmental Studies
Physical Science
Provider:
CLEAN: Climate Literacy and Energy Awareness Network
Provider Set:
CLEAN: Climate Literacy and Energy Awareness Network
Author:
NASA
Sphere feature LOOP
Date Added:
08/17/2018
Dam the Wilderness: Building "Green Hydropower" on Big Creek
Conditional Remix & Share Permitted
CC BY-NC-SA
Rating
0.0 stars

Student must synthesize the data that go into the construction and operation of a large hydroelectric dam. Students must strive to develop a design that minimizes or mitigates the impacts of the dam on the existing watershed. Students divide the analysis and frequently present to each other their findings. These findings are then synthesized into independent reports produced by each student.
Designed for a geomorphology course
Uses online and/or real-time data
Uses geomorphology to solve problems in other fields
Addresses student misconceptions

(Note: this resource was added to OER Commons as part of a batch upload of over 2,200 records. If you notice an issue with the quality of the metadata, please let us know by using the 'report' button and we will flag it for consideration.)

Subject:
Applied Science
Biology
Business and Communication
Environmental Science
Hydrology
Life Science
Management
Physical Science
Political Science
Social Science
Material Type:
Lesson Plan
Provider:
Science Education Resource Center (SERC) at Carleton College
Provider Set:
Teach the Earth
Author:
Ben Crosby
Date Added:
08/28/2019
Data Review and Action Plan (Art for the Earth #5)
Conditional Remix & Share Permitted
CC BY-NC
Rating
0.0 stars

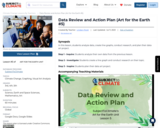
SYNOPSIS: In this lesson, students analyze data, create line graphs, conduct research, and plan their data art project.

SCIENTIST NOTES: This lesson builds students' data analysis and research skills. Students learn how to use data to create an appealing artwork that can explain and raise awareness on climate change impacts. All materials are properly sourced, and datasets for analysis are accurate. The lesson has passed our science credibility process.

POSITIVES:
-Students learn how to create a line graph that includes title, x-axis label, y-axis label, data points, and a line connecting the data points.
-Students think critically in their groups and in whole class discussions.
-Students practice media literacy skills when conducting research.

ADDITIONAL PREREQUISITES:
-This is lesson 5 of 6 in our 3rd-5th grade Art for the Earth unit.
-Students should have a basic understanding of data analysis and why graphs are useful tools to view data.
-You may have to guide students to good resources when they are conducting research on their topic in the Investigate section. A great tip when students are doing online research is to use the PARC method, which stands for Purpose, Author, Reliability, and Currency. Students can ask of every website:
-What is the purpose of this website?
-Who is the author of this website?
-Is this website reliable?
-Is this website current?

DIFFERENTIATION:
-It may be best for students to collaborate when creating their line graphs. Grouping students with varying levels of logical-mathematical intelligence and spatial-visual intelligence would probably work best.
-Line graphs can also be created using technology tools, including iPads or Chromebooks.
-Your students may or may not have different line graphs. If the data comes from a true class campaign, all students will have the same line graph. If students gathered their own data for different issues or used the different available data from NASA, their line graphs will be different.
-The Inspire section is meant for students to prepare to complete their projects. They will actually finish their projects in the sixth lesson in this unit after discussing more about the impact of art on one's feelings, how colours affect emotions, and how to appeal to different audiences.

Subject:
Arts and Humanities
Geoscience
Mathematics
Physical Science
Space Science
Visual Arts
Material Type:
Lesson Plan
Provider:
SubjectToClimate
Author:
Lindsey Pockl
Monica Lilley
Date Added:
06/28/2023
Data Review and Action Plan (Art for the Earth #5)
Conditional Remix & Share Permitted
CC BY-NC
Rating
0.0 stars

In this lesson, students analyze data, create line graphs, conduct research, and plan their data art project.

Step 1 - Inquire: Students analyze their own data from the previous lesson.

Step 2 - Investigate: Students create a line graph and conduct research on their topic.

Step 3 - Inspire: Students plan their data art project.

Subject:
Applied Science
Arts and Humanities
Environmental Science
Material Type:
Lesson
Lesson Plan
Provider:
SubjectToClimate
Author:
Lindsey Pockl
Subject to Climate
Date Added:
04/06/2023
Data Set Not Found | National Snow and Ice Data Center
Read the Fine Print
Rating
0.0 stars

This visualization tool shows sea ice data from 1978 to the present. Selected data can be animated to show changes in sea ice extent over time. Data is added by the National Snow and Ice Data Center as it becomes available.

Subject:
Applied Science
Career and Technical Education
Environmental Science
Environmental Studies
Physical Science
Material Type:
Simulation
Provider:
CLEAN: Climate Literacy and Energy Awareness Network
Provider Set:
CLEAN: Climate Literacy and Energy Awareness Network
Author:
National Snow and Ice Data Center
Date Added:
08/17/2018
Data Storytelling Studio: Climate Change
Conditional Remix & Share Permitted
CC BY-NC-SA
Rating
0.0 stars

This course explores visualization methodologies to conceive and represent systems and data, e.g., financial, media, economic, political, etc., with a particular focus on climate change data in this version of the course. Topics include basic methods for research, cleaning, and analysis of datasets, and creative methods of data presentation and storytelling. The course considers the emotional, aesthetic, ethical, and practical effects of different presentation methods as well as how to develop metrics for assessing impact. Coursework includes readings, visualization exercises, and a final project.

Subject:
Anthropology
Arts and Humanities
Business and Communication
Communication
Graphic Arts
Social Science
Visual Arts
Material Type:
Full Course
Provider:
MIT
Provider Set:
MIT OpenCourseWare
Author:
Bhargava, Rahul
Date Added:
02/01/2017
Data.gov
Unrestricted Use
Public Domain
Rating
0.0 stars

The home of the U.S. Government’s open data. Here you will find data, tools, and resources to conduct research, develop web and mobile applications, design data visualizations, and more. Topics include Agriculture, Business, Climate, Education, Energy, Ecosystems, Manufacturing and more.

Subject:
Applied Science
Information Science
Life Science
Physical Science
Social Science
Material Type:
Data Set
Provider:
U.S. General Services Administration
Provider Set:
Office of Citizen Services and Innovative Technologies
Date Added:
03/04/2016
Dating Students: Relative vs. Numerical Time
Conditional Remix & Share Permitted
CC BY-NC-SA
Rating
0.0 stars

In this lab, students are introduced to the difference between relative and absolute dating, using the students themselves as the material to be ordered. Initially, the students are asked to develop physical clues to put themselves in order from youngest to oldest (exposing the inferences we make unconsciously about people's ages), and this will be refined/modified using a list of current events from an appropriate historical period that more and more of the students will remember, depending on their age (among other variables). Absolute age is introduced by having the students order themselves by birth decade, year, month, and day, and comparing the absolute age order to the order worked out in the relative-dating exercise, with a discussion of dating precision and accuracy.

(Note: this resource was added to OER Commons as part of a batch upload of over 2,200 records. If you notice an issue with the quality of the metadata, please let us know by using the 'report' button and we will flag it for consideration.)

Subject:
Applied Science
Biology
Environmental Science
Geology
Information Science
Life Science
Mathematics
Measurement and Data
Physical Science
Material Type:
Activity/Lab
Provider:
Science Education Resource Center (SERC) at Carleton College
Provider Set:
Teach the Earth
Author:
Susan Zimmerman
Date Added:
08/10/2019
Dead Diatoms Do Tell Tales
Read the Fine Print
Rating
0.0 stars

The students get to be climate detectives as they make a model of sediment cores using different kinds of glass beads and sand. They learn how to examine the types, numbers, and conditions of diatom skeletons in the model sediment cores and tell something about the hypothetical paleoclimate that existed when they were deposited.

Subject:
Geoscience
History
History, Law, Politics
Physical Science
Material Type:
Activity/Lab
Provider:
CLEAN: Climate Literacy and Energy Awareness Network
Provider Set:
CLEAN: Climate Literacy and Energy Awareness Network
Author:
ANDRILL
LuAnn Dahlman
Date Added:
10/27/2014
Deadly Heat Waves Projected in the Densely-Populated Agricultural Regions of South Asia
Unrestricted Use
CC BY
Rating
0.0 stars

This resource is a video abstract of a research paper created by Research Square on behalf of its authors. It provides a synopsis that's easy to understand, and can be used to introduce the topics it covers to students, researchers, and the general public. The video's transcript is also provided in full, with a portion provided below for preview:

"The Earth is undeniably getting hotter. For the third time in a row, the past year has gone down as the hottest on record. While researchers don’t expect every year to be record-shattering, the trend is disconcerting—perhaps nowhere more so than in South Asia. A new study shows that here, unique climate effects converge with poor living conditions and high population density to create the most at-risk hot spot on our planet. Climate data shows that some of the world’s hottest zones lie across Asia. In these areas, the wet-bulb temperature, a measure of temperature that accounts for humidity, reaches life-threatening highs, commonly above 28°C. For perspective, consider that spending just a few hours at a wet-bulb temperature of 35°C is enough to cause death. And according to an international team of researchers, this heating trend might only get worse..."

The rest of the transcript, along with a link to the research itself, is available on the resource itself.

Subject:
Atmospheric Science
Physical Science
Material Type:
Diagram/Illustration
Reading
Provider:
Research Square
Provider Set:
Video Bytes
Date Added:
03/22/2021
Debating the Grid Example
Read the Fine Print
Educational Use
Rating
0.0 stars

Students research electricity, its sources, how energy grids function, how to make grids most efficient, and how to bring different types of energy generation together to diversify grids. Students debate the costs and benefits of moving to a modernized Smart Grid.

Subject:
Applied Science
Atmospheric Science
Career and Technical Education
Environmental Science
Environmental Studies
Physical Science
Material Type:
Activity/Lab
Lesson
Lesson Plan
Provider:
CLEAN: Climate Literacy and Energy Awareness Network
Provider Set:
CLEAN: Climate Literacy and Energy Awareness Network
Author:
Cheryl Manning
Climate Literacy and Energy Awareness Network (CLEAN)
Date Added:
04/20/2022
Debunking Cranky Uncle on past climate change
Read the Fine Print
Educational Use
Rating
0.0 stars

This humorous short video uses the 'single-cause fallacy' to debunk the myth that current changes in the Earth's climate are a result of natural phenomenon. The video is one of several in the 'Cranky Uncle' series.

Subject:
Applied Science
Career and Technical Education
Environmental Science
Environmental Studies
Physical Science
Material Type:
Diagram/Illustration
Reading
Provider:
CLEAN: Climate Literacy and Energy Awareness Network
Provider Set:
CLEAN: Climate Literacy and Energy Awareness Network
Author:
John Cook
Date Added:
07/05/2021