Updating search results...

Search Resources

10000 Results

View
Selected filters:
  • College / Upper Division
Analytical Techniques for Studying Environmental and Geologic Samples
Conditional Remix & Share Permitted
CC BY-NC-SA
Rating
0.0 stars

This is a laboratory course supplemented by lectures that focus on selected analytical facilities that are commonly used to determine the mineralogy, elemental abundance and isotopic ratios of Sr and Pb in rocks, soils, sediments and water.

Subject:
Applied Science
Atmospheric Science
Chemistry
Environmental Science
Physical Science
Material Type:
Full Course
Provider:
MIT
Provider Set:
MIT OpenCourseWare
Author:
Bowring, Samuel
Boyle, Edward
Chatterjee, Nilanjan
Dudas, Francis
Date Added:
02/01/2011
Analytical and Numerical Insight into Lava Flows and Cinder Cones on Earth, Mars and Venus
Conditional Remix & Share Permitted
CC BY-NC-SA
Rating
0.0 stars

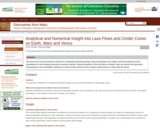
Comparative planetary geology requires understanding how geological processes are affected by changes in physical environment-each planet and moon provides an opportunity to refine our understanding of how physical geological processes operate. Volcanism is a great example of a major geological process highly susceptible to such variations. Students performing this exercise will constrain how "Amboy Crater" would look if the same eruption happened on the Moon and Mars. Part 1 of the exercise asks small groups to assess either the yield strength of the Amboy flows or the time required for the flow to travel a given distance. After discussion of the results, Part 2 asks students to characterize the dimensions of the same flow, if emplaced on Mars or the Moon (changing only gravitational acceleration), and the time required for it to form; they are asked to predict the outcome in advance. Part 3 uses "Erupt" freeware by Ken Wohletz to explore how gravity changes will affect cinder cone geometry; the model is tested first to see if it correctly predicts an Amboy-like geometry, and afterwards students are asked to brainstorm what other factors should also be modified to improve the accuracy of the simulation, and how these changes would be expected to affect the geomorphological outcome. Finally, Part 4 asks students to use simple ballistic equations, implemented via an online Applet (Stromboli), to constrain the launch angle and starting velocity for the eruption that formed Amboy Crater (modifications are supposedly underway to permit this applet to run with different values of gravitational acceleration and air resistance).

(Note: this resource was added to OER Commons as part of a batch upload of over 2,200 records. If you notice an issue with the quality of the metadata, please let us know by using the 'report' button and we will flag it for consideration.)

Subject:
Biology
Life Science
Mathematics
Measurement and Data
Statistics and Probability
Material Type:
Activity/Lab
Provider:
Science Education Resource Center (SERC) at Carleton College
Provider Set:
Teach the Earth
Author:
Eric Grosfils
Date Added:
08/10/2019
Analyzing Data on American Political Divisions
Conditional Remix & Share Permitted
CC BY-NC-SA
Rating
0.0 stars

Students conducted data analysis about American political divisions and created two papers from this data analysis. Sutdents were assigned to group projects involving data analysis assigned chapters in MICROCASE AMERICAN GOVERNMENT, a textbook that includes access to a variety of datasets.

Subject:
Political Science
Social Science
Material Type:
Activity/Lab
Provider:
Science Education Resource Center (SERC) at Carleton College
Provider Set:
Pedagogy in Action
Author:
Steven Schier
Date Added:
11/06/2014
Analyzing Fault/Fracture Patterns
Conditional Remix & Share Permitted
CC BY-NC-SA
Rating
0.0 stars

During a lab period, students go out in the field to an area that contains at least 2 fault/fracture sets. Students measure orientations of faults and make observations about the relationship between different fault sets. After the field trip, the students compile their field data, plot it on a stereonet and write-up a brief report. In this report students will use their field observations and stereonet patterns to determine whether faults are related or unrelated to each other.

(Note: this resource was added to OER Commons as part of a batch upload of over 2,200 records. If you notice an issue with the quality of the metadata, please let us know by using the 'report' button and we will flag it for consideration.)

Subject:
Biology
Life Science
Material Type:
Activity/Lab
Provider:
Science Education Resource Center (SERC) at Carleton College
Provider Set:
Teach the Earth
Author:
Jamie Levine
Date Added:
09/01/2019
Analyzing Institutional Publishing Output: A Short Course
Unrestricted Use
CC BY
Rating
0.0 stars

This short course provides training materials about how to create a set of publication data, gather additional information about the data through an API (Application Programming Interface), clean the data, and analyze the data in various ways. Developing these skills will assist academic librarians who are:

Negotiating a renewal of a journal package or an open access publishing agreement,
Interested in which journals the institution's authors published in or which repositories the institution’s authors shared their works in,
Looking to identify publications that could be added to your repository,
Searching for authors who do or do not publish OA for designing outreach programs, or
Tracking how open access choices have changed over time.
After completing the lessons, the user will be able to gain an understanding of an institution’s publishing output, such as number of publications per year, open access status of the publications, major funders of the research, estimates of how much funding might be spent towards article processing charges (APCs), and more. The user will also be better prepared to think critically about institutional publishing data to make sustainable and values-driven scholarly communications decisions.

The course is presented in two sections. Section 1 describes how to build a dataset. Section 2 describes a free, open source tool for working with data. Examples of how to do analyses both in OpenRefine and Microsoft Excel are provided.

This short course was created for the Scholarly Communication Notebook. The file "Analyzing Institutional Publishing Output-A Short Course.docx" serves as a table of contents for the materials.

Subject:
Applied Science
Information Science
Material Type:
Unit of Study
Author:
Ana Enriquez
Allison Langham-Putrow
Date Added:
03/23/2022
Analyzing datasets in ecology and evolution to teach the nature and process of science
Conditional Remix & Share Permitted
CC BY-NC-SA
Rating
0.0 stars

This quarter-long project forms the basis of a third-year course for majors and nonmajors at the University of Washington, Bothell called Science Methods and Practice. Students use databases to identify novel research questions, and extract data to test their hypotheses. They frame the question with primary literature, address the questions with inferential statistics, and discuss the results with more primary literature. The product is a scientific paper; each step of the process is scaffolded and evaluated. Given time limitations, we avoid devoting time to data collection; instead, we sharpen
students' ability to make sense of a large body of quantitative data, a situation they may rarely have encountered.

We treat statistics with a strictly conceptual, pragmatic, and abbreviated approach; i.e., we ask students to know which basic test to choose to assess a linear relationship vs. a difference between two means. We stress the need for a normal distribution
in order to use these tests, and how to interpret the results; we leave the rest for stats courses, and we do not teach the mathematics. This approach proves beneficial even to those who have already had a statistics course, because it is often the first time
they make decisions about applying statistics to their own research questions.

We incorporate peer review and collaborative work throughout the quarter. We form collaborative groups around the research questions they ask, enabling them to share primary literature they find, and preparing them well to review each other's writing. We encourage them to cite each other's work. They write formal peer reviews of each other's papers, and they submit their final paper with a letter-to-the-editor highlighting how their research has addressed previous feedback.

A major advantage of this course is that an instructor can easily modify it to suit any area of expertise. Students have worked with data about how a snail's morphology changes in response to its environment (Price, 2012), how students understand genetic drift (Price et al. 2014), maximum body size in the fossil record (Payne et al. 2008), range shifts (Ettinger et al. 2011), and urban crop pollination (Waters and Clifford 2014).

(Note: this resource was added to OER Commons as part of a batch upload of over 2,200 records. If you notice an issue with the quality of the metadata, please let us know by using the 'report' button and we will flag it for consideration.)
Subject:
Applied Science
Biology
Environmental Science
Life Science
Material Type:
Activity/Lab
Provider:
Science Education Resource Center (SERC) at Carleton College
Provider Set:
Teach the Earth
Author:
Rebecca Price
Date Added:
06/14/2022
Analyzing the Elements of Real GDP in FRED Using Stacking
Read the Fine Print
Educational Use
Rating
0.0 stars

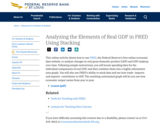
This online activity shows how to use FRED, the Federal Reserve's free online economic data website, to analyze changes in real gross domestic product (GDP) and GDP makeup over time. Following simple instructions, you will locate spending data for the individual components of real GDP, and then combine them into a highly informative area graph. You will also use FRED's ability to stack data and see how trade—imports and exports—contributes to GDP. The resulting customized graph will let you see how economic output varies from year to year.

Subject:
Economics
Social Science
Material Type:
Activity/Lab
Lesson
Lesson Plan
Provider:
Federal Reserve Bank of St. Louis
Provider Set:
Economic Lowdown Lessons
Author:
Mark Bayles
Date Added:
09/11/2019
Analyzing the Last Five Years of the US Economy for an Intermediate Macro Course
Conditional Remix & Share Permitted
CC BY-NC-SA
Rating
0.0 stars

Intermediate students are asked to analyze data on the components of consumption and investment expenditures and explanatory variables based on textbook models of each. Students look for rough correlations between the explanatory and dependent variables.

Subject:
Business and Communication
Economics
Social Science
Material Type:
Activity/Lab
Homework/Assignment
Provider:
Science Education Resource Center (SERC) at Carleton College
Provider Set:
Quantitative Writing (SERC)
Author:
Steven Greenlaw
Date Added:
08/28/2012
Anamnèse et examen clinique du rachis
Conditional Remix & Share Permitted
CC BY-NC-SA
Rating
0.0 stars

Le diagnostic est défini comme l’ensemble des mesures réalisées afin d’identifier la nature et la cause des pathologies. Cette recherche est par essence imparfaite et tout thérapeute visera, autant que faire se peut, à s’approcher au plus près du diagnostic. Dans ce processus, plusieurs modalités (anamnèse, examen clinique et examens complémentaires) seront nécessaires tout en restant insuffisantes - ou pour le moins imprécises - lorsqu’elles seront considérées de manière isolée. Au final, c’est la synthèse de ces données qui nous offrira la meilleure vision d’une pathologie nécessairement spécifique et individuelle. La médecine se trouve à mi-distance entre les sciences exactes et les sciences humaines. Certains la définissent aussi comme un art, c’est-à-dire comme une capacité individuelle qu’aurait chaque médecin à soigner. En partie en réaction avec cette idée, depuis une trentaine d’années, l’Evidence Based Medicine s’est progressivement imposée dans les parcours thérapeutiques en même temps qu’une multitude de nouveaux examens complémentaires. Cette évolution vers davantage de science se voit aujourd’hui modérée par un retour progressif à une prise en charge plus globale des patients et c’est probablement à mi-chemin que se trouvera la meilleure stratégie. L’avantage de cette méthode est appuyé par la littérature scientifique actuelle qui montre, chaque jour un peu plus, l’interconnexion des différentes pathologies là-même où nous aurions pensé les séparer par une frontière bien nette. La prise en charge du patient dans sa globalité est garantie par un interrogatoire et un examen clinique bien conduits. Eux seuls peuvent efficacement orienter la nécessité d’examens complémentaires dont la précision extrême reste limitée soit dans l’espace (une IRM lombaire ne couvre que quelques vertèbres…) soit par leur technologie (faible résolution spatiale de la scintigraphie...). La pathologie rachidienne est décrite, à cause de sa prévalence, comme la pathologie du siècle. Elle constitue un des premiers motifs de consultation. Son impact est important sur le plan socio-économique et sur le plan de la santé publique. En effet, en termes d’invalidité, les problèmes lombaires sont au premier plan, suivis par la dépression et les autres affections musculo-squelettiques. Le vieillissement de nos populations s’accompagne d’une augmentation des pathologies dégénératives - y compris rachidiennes - associant des symptômes d’enraidissement, de douleur, de déformation ou de déficit neurologique. Dans ce chapitre, nous nous efforcerons de mettre en lumière les éléments fondamentaux à recueillir dans le cadre d’une consultation en pathologie rachidienne. Il ne s’agit donc pas d’une description exhaustive de l’ensemble des techniques d’interrogatoire et d’examen clinique mais plutôt d’un recueil d’étapes nécessaires pour pouvoir s’orienter correctement et parler un même langage.

Subject:
Applied Science
Health, Medicine and Nursing
Material Type:
Textbook
Provider:
Université catholique de Louvain
Provider Set:
OER-UCLOUVAIN
Author:
Irda Nadia
Kaminski Ludovic
Date Added:
01/27/2023