This activity provides an opportunity for the student to collect data on …
This activity provides an opportunity for the student to collect data on their individual water use to set the stage for a unit on water resources.
(Note: this resource was added to OER Commons as part of a batch upload of over 2,200 records. If you notice an issue with the quality of the metadata, please let us know by using the 'report' button and we will flag it for consideration.)
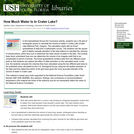
Students keep track of their own water usage for one week, gaining …
Students keep track of their own water usage for one week, gaining an understanding of how much water is used for various everyday activities. They relate their own water usages to the average residents of imaginary Thirsty County, and calculate the necessary water capacity of a dam that would provide residential water to the community.
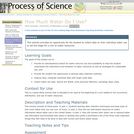
Spreadsheets Across the Curriculum module/Geology of National Parks course. Students calculate an …
Spreadsheets Across the Curriculum module/Geology of National Parks course. Students calculate an answer from a bathymetric map by summing volumes of vertical prisms.
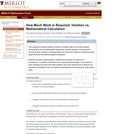
This classroom activity presents Calculus II students with some Flash tutorials involving …
This classroom activity presents Calculus II students with some Flash tutorials involving work and pumping liquids and a simple question concerning the amount of work involved in pumping water out of two full containers having the same shape and size but different spatial orientations.
This video segment adapted from KET's Where the River Bends demonstrates how …
This video segment adapted from KET's Where the River Bends demonstrates how climate change and glacier movement during the Ice Ages destroyed the old Teays River and created the Ohio River, Kentucky's northern border.
In this problem-based learning (PBL) activity, students take on the role of …
In this problem-based learning (PBL) activity, students take on the role of a student research scientist and explore the role of solar energy in determining climate. Students conduct experiments to observe how a change in water phase affects surface temperatures. Materials required for the investigation include 2 aquariums, dry sand or soil, two heat lamps, and two thermometers.The lesson is supported by teacher notes, answer key, glossary and an appendix with information about using PBL in the classroom. This is the second of three activities in Investigating the Climate System: Energy, a Balancing Act.
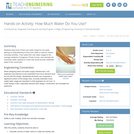
Students learn about the underlying engineering principals in the inner workings of …
Students learn about the underlying engineering principals in the inner workings of a simple household object -- the faucet. Students use the basic concepts of simple machines, force and fluid flow to describe the path of water through a simple faucet. Lastly, they translate this knowledge into thinking about how different designs of faucets also use these same concepts.
Students use basic aqueous geochemistry knowledge to investigate controls of the atmospheric …
Students use basic aqueous geochemistry knowledge to investigate controls of the atmospheric carbon dioxide level on pH values of the wet precipitation at standard conditions (25 oC, 1 atmospheric pressure).
(Note: this resource was added to OER Commons as part of a batch upload of over 2,200 records. If you notice an issue with the quality of the metadata, please let us know by using the 'report' button and we will flag it for consideration.)
This Lesson Plan is an inquiry based lesson plan that is geared …
This Lesson Plan is an inquiry based lesson plan that is geared towards third graders. It teaches them about all the different parts of a plant and what makes a plant grow and how they grow. I created this lesson plan with two other classmates. Through this lesson plan the students will be split into groups. Each group will be assigned a flower. They will research their flower and figure out what they need in order to grow (amount of water, amount of sunlight, etc.). They will grow their flowers in class and watch as they change over time!
In this lesson students will learn about the human demands of freshwater …
In this lesson students will learn about the human demands of freshwater and how clean drinking water is being impacted. Students will analyze the issues of cause and effect between human activities and water sustainability. Students will demonstrate this knowledge by create a presentation illustrating the effects of human activities on water resources.
In this problem-based learning activity, students learn about weather forecasting and the …
In this problem-based learning activity, students learn about weather forecasting and the role of the TRMM (Tropical Rainfall Measuring Mission) satellite in data collection. Assuming the role of climatologists, students assist a reporter in determining the accuracy of weather predictions published in The Old Farmer's Almanac. The lesson requires a street map of the local community, acetate sheets to cover the map, materials needed to build a homemade rain gauge, and sample pages of the almanac. Teacher notes, student worksheet, glossary and an appendix introducing problem-based learning are included. This resource is the first of the 3-part learning module, Investigating the Climate System: Precipitation.
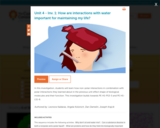
In this investigation, students will learn how non-polar interactions in combination with …
In this investigation, students will learn how non-polar interactions in combination with polar interactions they learned about in the previous unit effect shape of biological molecules and their function. This investigation builds towards PE HS-PS3-5 and PE HS-LS1-6.
In this kinesthetic activity, the concept of energy budget is strengthened as …
In this kinesthetic activity, the concept of energy budget is strengthened as students conduct three simulations using play money as units of energy, and students serve as parts of a planetary radiation balance model. Students will determine the energy budget of a planet by manipulating gas concentrations, energy inputs and outputs in the system in this lesson that supports the study of climate on Mars, Mercury, Venus and Earth. The lesson supports understanding of the real-world problem of contemporary climate change. The resource includes a teacher's guide and several student worksheets. This is the second of four activities in the lesson, How do Atmospheres affect planetary temperatures?, within Earth Climate Course: What Determines a Planet's Climate? The resource aims to help students to develop an understanding of our environment as a system of human and natural processes that result in changes that occur over various space and time scales.
The lesson provides an overview of cloud formation. Cloud formation results when …
The lesson provides an overview of cloud formation. Cloud formation results when warm, humid air rises and cools, causing the water vapor in the air to condense and form clouds. In this lesson, students will conduct an activity that demonstrates how this occurs. This lesson results from a collaboration between the Alabama State Department of Education and ASTA. This lesson was modified from NASA series "Investigating the Climate System. They can be freely downloaded at https://www.strategies.org/wp-content/uploads/2011/12/Clouds_04.pdf
Carbon science researchers and secondary school teachers invite young people to learn about local and global impacts of climate change, explore scientific research on the topic and act locally to reduce emissions of greenhouse gases.
This resource is a video abstract of a research paper created by …
This resource is a video abstract of a research paper created by Research Square on behalf of its authors. It provides a synopsis that's easy to understand, and can be used to introduce the topics it covers to students, researchers, and the general public. The video's transcript is also provided in full, with a portion provided below for preview:
"Coral reefs are important ocean ecosystems. However, they have been declining in recent years due to human activities, including elevated nitrate in the water. Corals maintain complex relationships with numerous microbes, including the dinoflagellate algae Symbiodiniaceae and bacteria. To better understand the impact of nitrate on coral and their resident microbes, researchers recently examined coral and microbial gene expression changes in larval Pocillopora damicornis. Under elevated nitrate conditions, the Symbiodiniaceae algae generally hoarded more nutrients for its own growth. Normally Symbiodiniaceae share nutrients with the coral, so this was a shift from a mutualistic relationship to a parasitic one, which led to impaired development in the larval coral. However, the prokaryotic microbes might reduce this negative interaction by restraining Symbiodiniaceae growth, which partially restores coral larval development..."
The rest of the transcript, along with a link to the research itself, is available on the resource itself.
This classroom activity allows students to use water surface temperature, bathymetric data …
This classroom activity allows students to use water surface temperature, bathymetric data and weather data to look at trends in the water temperature of the Great Lakes. The exercise asks students to make predictions, and then use the data to answer questions. The site contains everything that is needed for the exercise, including student handouts, maps, links to data sources, and background information and questions for discussion.
In this unit, students will explore the issue of ocean acidification by …
In this unit, students will explore the issue of ocean acidification by investigating the effects of increasing carbon dioxide concentrations in air and water, researching the impacts of acidity on living organisms, and developing and revising models of how these components interact. By the end of the unit, models will be used to support student explanations of ocean acidification and to explore and test ideas for decreasing its environmental impact upon Earth's oceans and the organisms that live there. This unit builds toward NGSS PE's: MS-LS2-3 and MS-ESS2-1.
This resource is a video abstract of a research paper created by …
This resource is a video abstract of a research paper created by Research Square on behalf of its authors. It provides a synopsis that's easy to understand, and can be used to introduce the topics it covers to students, researchers, and the general public. The video's transcript is also provided in full, with a portion provided below for preview:
"Climate change may negatively impact cold-water fish while benefiting their parasites. That is the finding of a new study conducted by researchers at the University of Münster. An important biological question regarding climate change is how ecological and evolutionary dynamics will be altered in the face of temperature shifts. Climate change is expected to impact many species -- and parasites are no exception. But few studies have conducted empirical tests to determine precisely how environmental changes will affect host-parasite dynamics. To provide insights into this, a team of researchers conducted an experiment involving three-spined sticklebacks, a tapeworm parasite, and varying water temperatures. Sticklebacks -- and the tapeworms that infect them -- occupy a wide environmental range, making this an ideal system for studying such interactions..."
The rest of the transcript, along with a link to the research itself, is available on the resource itself.
This lesson is about the estimation of the value of Pi. Based …
This lesson is about the estimation of the value of Pi. Based on previous knowledge, the students try to estimate Pi value using different methods, such as: direct physical measurements; a geometric probability model; and computer technology. This lesson is designed to stimulate the learning interests of students, to enrich their experience of solving practical problems, and to develop their critical thinking ability. To understand this lesson, students should have some mathematic knowledge about circles, coordinate systems, and geometric probability. They may also need to know something about Excel. To estimate Pi value by direct physical measurements, the students can use any round or cylindrical shaped objects around them, such as round cups or water bottles. When estimating Pi value by a geometric probability model, a dartboard and darts should be prepared before the class. You can also use other games to substitute the dart throwing game. For example, you can throw marbles to the target drawn on the floor. This lesson is about 45-50 minutes. If the students know little about Excel, the teacher may need one more lesson to explain and demonstrate how to use the computer to estimate Pi value. Downloadable from the website is a video demonstration about how to use Excel for estimating Pi.
No restrictions on your remixing, redistributing, or making derivative works. Give credit to the author, as required.
Your remixing, redistributing, or making derivatives works comes with some restrictions, including how it is shared.
Your redistributing comes with some restrictions. Do not remix or make derivative works.
Most restrictive license type. Prohibits most uses, sharing, and any changes.
Copyrighted materials, available under Fair Use and the TEACH Act for US-based educators, or other custom arrangements. Go to the resource provider to see their individual restrictions.