Think about the diverse learners in your classroom. How do we engage …
Think about the diverse learners in your classroom. How do we engage ALL learners in the curriculum content? In the Accessible Content for All modules, you will learn about Accessible Educational Material (AEM) and tech tools that are hidden in plain sight in your schools. You will hear teacher accounts of using tools like read-aloud, closed captioning, and translation to increase student engagement. These modules are self-paced and cover ways to create accessibility within Google, Microsoft, and IOS. Peruse the modules and explore the topics you want to learn more about. Create your own learning journey toward building accessibility, equity, and engagement in your classroom.
Alternative futures studies are a valuable yet resource-intensive way in which environmental …
Alternative futures studies are a valuable yet resource-intensive way in which environmental scientists try to conduct informed debates about policies for specific geographic regions. These studies require modeling what the future would look like if different stakeholder groups had their way. The modeling is carried out by applying historical trend data to future projections that are rooted in the preferences of the different groups. Alternative future studies can be controversial due to the limitations of modeling and to the extent to which the models represent fully the different possible scenarios. Yet, they can be especially valuable for decision making about which areas in the region would be most appropriate and most acceptable for the applications of different policies such as development and restoration. Through a series of hands-on classroom activities that are the culmination of a variety of field trips, case studies, and analyses of GIS data about river systems and river restoration options, the students build deep understanding about what alternative futures studies entail and what are the applications of such studies to specific rivers in the Puget Sound area.
(Note: this resource was added to OER Commons as part of a batch upload of over 2,200 records. If you notice an issue with the quality of the metadata, please let us know by using the 'report' button and we will flag it for consideration.)
Short Description: A comprehensive survey of American Environmental History Long Description: For …
Short Description: A comprehensive survey of American Environmental History
Long Description: For too long the environment has been considered little more than a neutral background to history. This text surveys findings of the new field of Environmental History about how the environment of the Americas influenced the actions of people here and how people affected their environments, from prehistory to the present.
Word Count: 80438
(Note: This resource's metadata has been created automatically by reformatting and/or combining the information that the author initially provided as part of a bulk import process.)
The goal of this course is to investigate with students backgrounds on …
The goal of this course is to investigate with students backgrounds on some of the pivotal events that have shaped our understanding and approach to architecture. Emphasis of discussion will be primarily on buildings and works of individual architects. Canonical architects, buildings and movements that have exerted significant influences on the development of architecture will be studied in detail. We will visit some of these buildings for a first-hand look and to evaluate for ourselves their significance or lack thereof. As a final project, each student will analyze a building through drawings, text, bibliography and a physical model in a format ready for documentation and exhibition.
Assistive technology (AT) can be a powerful tool to support students with …
Assistive technology (AT) can be a powerful tool to support students with disabilities. The consideration of assistive technology for all students with an IEP is a requirement. How can this be done with fidelity and who participates in the decision-making process? These modules will provide educators and parents with resources on how to consider assistive technology.
In this module, we will explore how Individual Education Plan (IEP) teams …
In this module, we will explore how Individual Education Plan (IEP) teams can assess if assistive technology is required to reduce or remove learning barriers for students with a disability. In the past, IEP teams have looked to specialists as experts to conduct an assistive technology assessment for their students. However, the IEP team is the best expert on their student. It is best practice for the IEP to conduct an AT assessment on their students, with each team member contributing in the area of the assessment that aligns with their expertise. In this module, we will share the steps necessary for an assistive technology assessment, as well as resources and tools that will help the IEP team make data-informed decisions. Assessment ideas for common types of assistive technology tools will be discussed, such as tools for reading, writing, and math. In addition, resources will be shared for AT assessments that involve AT for vision, hearing, motor, and communication. We will also share WA State support agencies who exist to guide IEP teams during the AT assessment process.
The Assistive Technology in the Schools Course aims to to familiarize educators …
The Assistive Technology in the Schools Course aims to to familiarize educators and parents with assistive technology devices and services, and provide a foundational understanding of what it means to consider, assess, and implement assistive technology (AT) with students to remove learning barriers. This course includes four modules: Introduction to Assistive Technology, AT Consideration, AT Assessment, and AT Implementation. This first module, Introduction to Assistive Technology, highlights the difference between accessible technology and assistive technology. This module explores examples of how assistive technology devices and services can help reduce learning barriers for students with disabilities across learning environments. Module Objective:Participants will be able to understand and describe inclusive technology and the difference between accessible educational material(AEM), accessible technology, and assistive technology(AT). Participants will be able to identify 3 examples of assistive technology devices/tools that have the potential to remove learning barriers for students.Participants will be able to identify 2 examples of assistive technology services within the education system.
This learning video continues the theme of an early BLOSSOMS lesson, Flaws …
This learning video continues the theme of an early BLOSSOMS lesson, Flaws of Averages, using new examples—including how all the children from Lake Wobegon can be above average, as well as the Friendship Paradox. As mentioned in the original module, averages are often worthwhile representations of a set of data by a single descriptive number. The objective of this module, once again, is to simply point out a few pitfalls that could arise if one is not attentive to details when calculating and interpreting averages. Most students at any level in high school can understand the concept of the flaws of averages presented here. The essential prerequisite knowledge for this video lesson is the ability to calculate an average from a set of numbers. Materials needed include: pen and paper for the students; a blackboard or equivalent; and coins (one per student) or something similar that students can repeatedly use to create a random event with equal chances of the two outcomes (e.g. flipping a fair coin). The coins or something similar are recommended for one of the classroom activities, which will demonstrate the idea of regression toward the mean. Another activity will have the students create groups to show how the average number of friends of friends is greater than or equal to the average number of friends in a group, which is known as The Friendship Paradox. The lesson is designed for a typical 50-minute class session.
Word Count: 21523 (Note: This resource's metadata has been created automatically by …
Word Count: 21523
(Note: This resource's metadata has been created automatically by reformatting and/or combining the information that the author initially provided as part of a bulk import process.)
Students design and build devices to protect and accurately deliver dropped eggs. …
Students design and build devices to protect and accurately deliver dropped eggs. The devices and their contents represent care packages that must be safely delivered to people in a disaster area with no road access. Similar to engineering design teams, students design their devices using a number of requirements and constraints such as limited supplies and time. The activity emphasizes the change from potential energy to kinetic energy of the devices and their contents and the energy transfer that occurs on impact. Students enjoy this competitive challenge as they attain a deeper understanding of mechanical energy concepts.
Dan Cohen (Northeastern University) present 'Bringing the Boston Globe Photo Morgue to …
Dan Cohen (Northeastern University) present 'Bringing the Boston Globe Photo Morgue to Life' during the AI & Collection Management session at the Fantastic Futures ai4LAM 2023 annual conference. This item belongs to: movies/fantastic-futures-annual-international-conference-2023-ai-for-libraries-archives-and-museums-02.
This item has files of the following types: Archive BitTorrent, Item Tile, MP3, MPEG4, Metadata, PNG, Thumbnail, h.264 720P, h.264 IA
SYNOPSIS: In this lesson, students calculate their own carbon footprint using Peter …
SYNOPSIS: In this lesson, students calculate their own carbon footprint using Peter Kalmus's methodology in his book Being the Change: Live Well and Spark a Climate Revolution.
SCIENTIST NOTES: This lesson shows basic techniques to calculate individual carbon footprint. There are no contradictions in the data source or methods for calculating carbon footprint as indicated in this lesson. All the examples shown are valid estimations. This lesson has passed our science review and is suitable for classroom.
POSITIVES: -This lesson features many math skills: addition, subtraction, multiplication, and division by rational numbers; estimation; conversion between metric and imperial units; and logic and reasoning skills. -Students manipulate data in a spreadsheet and create a pie chart using many different data points. -Students engage with many different units, including CO2e, CCF, kWh, and therms. -This lesson provides students with the opportunity to measure their own impact on the Earth. Students can reflect on their own impact and brainstorm ways to live a more sustainable lifestyle.
ADDITIONAL PREREQUISITES: -You must be sensitive to your students if you choose to run this lesson. Be mindful of socioeconomic status in your classroom. -Students will most likely ask their families for certain data points, like electricity or fossil gas usage. Be sensitive to your students' families. Some families may not want to share this information with their child's teacher. -In most situations, it would be useful for students to have the option to share final numbers with the class. You do not have to make it mandatory. -This lesson was adapted from "Leaving Fossil Fuel" Chapter 9 from Peter Kalmus's book Being the Change: Live Well and Spark a Climate Revolution.
DIFFERENTIATION: -This lesson can be used as an extension, extra credit opportunity, or one option in a menu of choices. -If everyone feels comfortable, students can collaborate as they figure out their respective carbon footprints. -Students should use the glossary at the end of the Teacher Slideshow to help them understand new terms and concepts. -Students can use the 2nd and 3rd tabs in their spreadsheets to see finished examples. This is author Dan Castrigano's carbon footprint data from 2019-2020.
In this lesson, students calculate their own carbon footprint using Peter Kalmus's …
In this lesson, students calculate their own carbon footprint using Peter Kalmus's methodology in his book Being the Change: Live Well and Spark a Climate Revolution.
Step 1 - Inquire: Students watch a short video on the climate crisis. Students engage in a brief discussion on the prompt "Do my individual actions matter?"
Step 2 - Investigate: Students calculate their own carbon footprints.
Step 3 - Inspire: Students engage in a discussion, reflecting on this activity and the importance of individual actions.
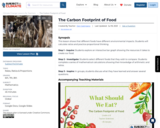
SYNOPSIS: This lesson shows that different foods have different environmental impacts. Students …
SYNOPSIS: This lesson shows that different foods have different environmental impacts. Students will calculate ratios and practice proportional thinking.
SCIENTIST NOTES: This lesson is thoroughly sourced. It is engaging and suitable for students to understand how to measure carbon footprint from food sources. The activities in the lesson would also enable them to build their quantitative skills to determine the extent of CO2 impact on the environment. The lesson has passed our science review, and it is advised for classroom use.
POSITIVES: -This lesson is great because it shows that different foods have different environmental impacts. -It shows the great disparity between certain types of foods. For example, creating 1 kg of beef (from a beef herd) emits 99.48 kgCO2eq. Creating 1 kg of potatoes creates only 0.46 kgCO2eq. Raising beef creates more than 200x the carbon dioxide than raising the same amount of potatoes!
ADDITIONAL PREREQUISITES: -You will need to share the Student Slideshow with students and grant them editing rights. They will all be writing in the same slideshow. -In general, animals and animal products use far more resources than plants. -Kilograms are used in this lesson. Some students will be unfamiliar with this unit. You can read more about the kilogram at Britannica. An easy conversion from kilograms to pounds is 1 kg = 2.2 lbs. -Kilograms of CO2 equivalent are also used in this lesson. This is pretty abstract for the students. You can have them imagine holding a 2.2-pound ball in their hands. This ball has mass and takes up space. This is the "pollution" generated when creating different foods.
DIFFERENTIATION: -You can create groups of students with mixed abilities. -If a group finishes early, you can ask these extension questions: -"Food 1’s emissions are what % of food 2’s emissions?" -"Can you convert your answers from kilograms to pounds?" -The Investigate section features a completed table of calculations. You can use this before the students begin their calculations. You can also share this with certain students or groups and let other groups complete their calculations on their own. Another option is to have students use the completed table to check their thinking when they are finished. There is a walkthrough of calculations in the speaker notes of this slide.
This lesson consists of a basic introduction to the cardiovascular and respiratory …
This lesson consists of a basic introduction to the cardiovascular and respiratory system(s) along with basic (common) diseases within each system. Diseases include atherosclerosis, heart attack, stroke, COPD (emphysema, chronic bronchitis). Screenings to detect various forms of cardiovascular disease are also included at an introductory level.
Short Description: CLEJHE is an open-access, double-blind peer-reviewed journal of case studies …
Short Description: CLEJHE is an open-access, double-blind peer-reviewed journal of case studies intended to aid in the preparation of leaders at all levels of higher education.
Long Description: Cases on Leadership for Equity and Justice in Higher Education (CLEJHE) is an open-access, open education resource journal that publishes peer-reviewed cases for use by leadership preparation programs and those involved in developing leaders for post-secondary institutions. Through an equity lens, the journal strives to publish timely and highly relevant cases that involve and address significant puzzles of practice facing leaders at all levels in higher education. Cases provide narratives, exhibits, and teaching notes that seek to inform and offer suggestions to enhance the practice of the learners and leaders within our community of practice.
CLEJHE is a collaborative project at the University of Colorado Denver involving ThinqStudio and the School of Education and Human Development programs for Leadership for Educational Equity in Higher Education and Learning, Design, and Technology (LDT). The journal editors are doctoral students from the Leadership for Educational Equity in Higher Education program.
Word Count: 22241
(Note: This resource's metadata has been created automatically by reformatting and/or combining the information that the author initially provided as part of a bulk import process.)
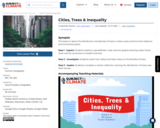
SYNOPSIS: This lesson is about the distribution and density of trees in …
SYNOPSIS: This lesson is about the distribution and density of trees in urban areas and how that relates to environmental justice.
SCIENTIST NOTES: This lesson uses data from peer-reviewed research that breaks down the forest cover in cities as it correlates to income. The evidence is clear and convincing that more affluent neighborhoods have more tree cover, which has a documented benefit on the residents. All external links are scientifically sound, and this lesson has pass our science quality assessment.
POSITIVES: -This is an engaging lesson because it is so personal. Students will think about tree cover where they live and how that relates to demographic data. -Students will practice their data analysis skills.
ADDITIONAL PREREQUISITES: -It is necessary to share the Student Slideshow with your students and give them editing access before beginning the lesson. All students will be writing in the same slideshow. -The videos list the benefits of trees pretty quickly. It might be hard for students to type fast enough to keep up. You could play the videos at 0.9 speed or replay parts of the videos as necessary. -The following is a list of benefits of trees. Students will create a similar list while they are watching the two videos outlining the benefits of trees.
-Reduce nearby outside temperatures -Reduce amount of energy used for heating and cooling buildings -Absorb carbon dioxide, thus mitigating climate change -Filter urban pollutants and fine particulates -Provide habitat, food, and protection to plants and animals -Provide food for people -Increase biodiversity -Provide wood that can be used at the end of a tree’s life -Improve physical and mental health of people -Increase property values -Create oxygen -Provide shade for people and animals -Control stormwater runoff, protecting water quality and reducing the need for water treatment -Protect against mudslides -Help prevent floods -Improve air quality -Increase attention spans and decrease stress levels in people -Improve health outcomes in hospital patients
DIFFERENTIATION: -Teachers can use the glossary at the end of the slideshow at any point throughout the lesson to help students understand vocabulary.
-The spreadsheet and the graph on slide 11 might be tricky. Encourage your students to turn and talk to one another for help.
-Many students will not have a good understanding of Celsius. Easy reminder: Multiply the temperature in Celsius by 1.8 to get degrees Fahrenheit. Example: 2.5°C x 1.8 = 4.5°F (The temperature difference between poorest and richest census blocks in Milwaukee, Wisconsin.)
No restrictions on your remixing, redistributing, or making derivative works. Give credit to the author, as required.
Your remixing, redistributing, or making derivatives works comes with some restrictions, including how it is shared.
Your redistributing comes with some restrictions. Do not remix or make derivative works.
Most restrictive license type. Prohibits most uses, sharing, and any changes.
Copyrighted materials, available under Fair Use and the TEACH Act for US-based educators, or other custom arrangements. Go to the resource provider to see their individual restrictions.
![[3ACTS] Nana’s Paint Mixup – dy](https://img.oercommons.org/160x134/oercommons/media/screenshots/7a2b8508c50073e7c2877b3a86cbbed269ebb452c7b220f88a2a048991793bdc.png)