This is a set of documents intended to teach 80% of the …
This is a set of documents intended to teach 80% of the Qur'an to learners. The philosophy is that since many of the words in the Qur'an are repeated, 80% of it can be learned quickly and easily by knowing what to focus on. Included are lists of vocabulary separated into genre, such as pronouns and ways to say 'no', verbs and verb conjugation charts, grammar charts detailing active and passive participles, and more. Many of the documents are in PDF as well as in Excel so that changes can be made to the templates, i.e. translation into other languages if desired.
A series of 6 Excel-based projects on the mathematics of biodiversity for …
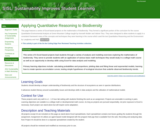
A series of 6 Excel-based projects on the mathematics of biodiversity for basic college math classes and developmental math classes. Students learn about the structure of biodiversity, the application of many basic data analysis skills, and the use of Excel for analysis and data presentation.
Measuring the dimensions of nano-circuits requires an expensive, high-resolution microscope with integrated …
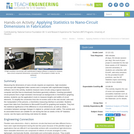
Measuring the dimensions of nano-circuits requires an expensive, high-resolution microscope with integrated video camera and a computer with sophisticated imaging software, but in this activity, students measure nano-circuits using a typical classroom computer and (the free-to-download) GeoGebra geometry software. Inserting (provided) circuit pictures from a high-resolution microscope as backgrounds in GeoGebra's graphing window, students use the application's tools to measure lengths and widths of circuit elements. To simplify the conversion from the on-screen units to the real circuits' units and the manipulation of the pictures, a GeoGebra measuring interface is provided. Students export their data from GeoGebra to Microsoft® Excel® for graphing and analysis. They test the statistical significance of the difference in circuit dimensions, as well as obtain a correlation between average changes in original vs. printed circuits' widths. This activity and its associated lesson are suitable for use during the last six weeks of the AP Statistics course; see the topics and timing note below for details.
Level I Microsoft Office Applications. Includes coverage of Windows, Microsoft Word, Excel, …
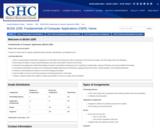
Level I Microsoft Office Applications. Includes coverage of Windows, Microsoft Word, Excel, and PowerPoint. Students apply problem techniques to complete a variety of projects, including integrating Office applications.
What is this course all about? To give you a basic level …
What is this course all about?
To give you a basic level of computer application literacy primarily, Spreadsheets, and database Excel
Learning objectives:
Gain an understanding of information competency, the Information Processing Cycle, Basic Components of the Personal Computer, and Technology used in the Workplace. Demonstrate the ability to Create and Edit Workbooks and Charts which utilize Functions and Formulas. Understand and applying the fundamental database concepts to spreadsheet development such as Importing, Creating Tables, Sorting and Filtering, and using Conditional Formatting. Use advanced spreadsheet concepts such as Working with Multiple Worksheets and Workbooks, applying Advanced Functions, Setting Validation, and Protecting Workbooks. Develop an understanding and exposure to new and emerging technologies Gain the ability to serve as an informed purchaser of technology (personal, commercial) Prepare a capstone project which applies concepts and principles of course to a unique series of problems.
This textbook was written for a community college introductory course in spreadsheets …
This textbook was written for a community college introductory course in spreadsheets utilizing Microsoft Excel. While the figures shown utilize Excel 2019, the textbook was written to be applicable to other versions of Excel as well. The book introduces new users to the basics of spreadsheets and is appropriate for students in any major who have not used Excel before. This textbook includes instructions for Excel for Mac also.
Students act as R&D entrepreneurs, learning ways to research variables affecting the …
Students act as R&D entrepreneurs, learning ways to research variables affecting the market of their proposed (hypothetical) products. They learn how to obtain numeric data using a variety of Internet tools and resources, sort and analyze the data using Excel and other software, and discover patterns and relationships that influence and guide decisions related to launching their products. First, student pairs research and collect pertinent consumer data, importing the data into spreadsheets. Then they clean, organize, chart and analyze the data to inform their product production and marketing plans. They calculate related statistics and gain proficiency in obtaining and finding relationships between variables, which is important in the work of engineers as well as for general technical literacy and decision-making. They summarize their work by suggesting product launch strategies and reporting their findings and conclusions in class presentations. A finding data tips handout, project/presentation grading rubric and alternative self-guided activity worksheet are provided. This activity is ideal for a high school statistics class.
This book is used in Reach Higher, Oklahoma's adult degree completion program, …
This book is used in Reach Higher, Oklahoma's adult degree completion program, for a course called Data Analysis & Interpretation. It provides basic statistics that can be used for organizational data analysis by individuals with managerial professional goals, while also teaching essential skills from Microsoft Excel commonly needed for data analysis. This book uses material from Lumen Learning's Boundless Statistics (Boundless Learning) and Excel for Decision Making from University of Houston Libraries (multiple authors).
This is an online textbook for a one semester calculus course aimed …
This is an online textbook for a one semester calculus course aimed at business students. The material covered is fairly standard: differentiation and integration without trigonometry, partial derivatives and optimization of functions of several variables. There are several characteristics that differentiate the text from other texts: Excel is used as the main computational engine throughout the text and the needed Excel skills are taught rather than assumed. Examples, exercises, and vocabulary are tailored to uses in a business curriculum. There is a modeling thread throughout the text. Webwork versions of exercises are available on request.
Igor Baryakhtar's Presentation at Virtual NEMATYC 2021 Conference, 4/08/2021.The technologies that support …
Igor Baryakhtar's Presentation at Virtual NEMATYC 2021 Conference, 4/08/2021.The technologies that support learning of introductory statistics are reviewed. Advantages and disadvantages of using Graphing calculator TI 83 / TI 84, StatCrunch (Pearson's web- based statistical software), Apple Numbers, Microsoft Excel, R language and software is discussed. Tablet implementation of Introductory Statistic Open Education Resources based course is described.
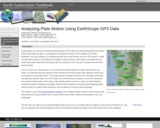
DATA: EarthScope GPS Data. TOOLS: Spreadsheet, Google Maps. SUMMARY: Learn how GPS …
DATA: EarthScope GPS Data. TOOLS: Spreadsheet, Google Maps. SUMMARY: Learn how GPS monuments make precise measurements of Earth's surface. Graph motion data and map velocity vectors to explore tectonic motion and surface deformation in the Pacific Northwest.
(Note: this resource was added to OER Commons as part of a batch upload of over 2,200 records. If you notice an issue with the quality of the metadata, please let us know by using the 'report' button and we will flag it for consideration.)
This intensive micro-subject provides the necessary skills in Microsoft® Excel spreadsheet modeling …
This intensive micro-subject provides the necessary skills in Microsoft® Excel spreadsheet modeling for ESD.71 Engineering Systems Analysis for Design. Its purpose is to bring entering students up to speed on some of the advanced techniques that we routinely use in analysis. It is motivated by our experience that many students only have an introductory knowledge of Excel, and thus waste a lot of time thrashing about unproductively. Many people think they know Excel, but overlook many efficient tools, such as Data Table and Goal Seek. It is also useful for a variety of other subjects.
In this activity, students use real water chemistry data and descriptive statistics …
In this activity, students use real water chemistry data and descriptive statistics in Excel to examine primary productivity in an urban estuary of the Salish Sea. They will consider how actual data do or do not support expected annual trends.
Students learn how to use and graph real-world stream gage data to …
Students learn how to use and graph real-world stream gage data to create event and annual hydrographs and calculate flood frequency statistics. Using an Excel spreadsheet of real-world event, annual and peak streamflow data, they manipulate the data (converting units, sorting, ranking, plotting), solve problems using equations, and calculate return periods and probabilities. Prompted by worksheet questions, they analyze the runoff data as engineers would. Students learn how hydrographs help engineers make decisions and recommendations to community stakeholders concerning water resources and flooding.
The Human Stopwatch 10 second experiment is an experiment that can be …
The Human Stopwatch 10 second experiment is an experiment that can be carried out with online instruction. Students get experience in predicting a 10-second interval and can use descriptive statistics to learn about measurement accuracy and precision.
Microsoft Excel is extremely useful for many different types of digital scholarship …
Microsoft Excel is extremely useful for many different types of digital scholarship projects. This one looks at the ability of Excel to create time lines for historical projects using an Excel template developed for project time lines. Before starting I will warn the reader that because of the way Excel stores and handles dates, these time lines only work for dates after Jan. 1, 1900. There are some potential fixes for this that I hope to address in the future.
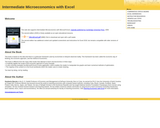
This book is based on the idea that there is a particular …
This book is based on the idea that there is a particular framework used by economists to interpret observed reality. This framework has been called the economic way of thinking, the economic approach, and the method of economics.
This book is different from the many other books that attempt to teach microeconomics in three ways:
It explicitly applies the recipe of the economic approach in every example. It uses concrete examples via Microsoft Excel in every application, which enables the reader to manipulate live graphs and learn numerical methods of optimization. The majority of the content is in the Excel workbooks which the reader uses to create meaning. You learn by doing, not by reading.
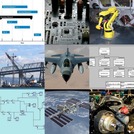
Textbook covering topics orienting undergraduate-level students to the major engineering disciplines (civil, …
Textbook covering topics orienting undergraduate-level students to the major engineering disciplines (civil, computer and electronic, and mechanical) and professionalism within these disciplines.
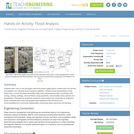
The learning of linear functions is pervasive in most algebra classrooms. Linear …
The learning of linear functions is pervasive in most algebra classrooms. Linear functions are vital in laying the foundation for understanding the concept of modeling. This unit gives students the opportunity to make use of linear models in order to make predictions based on real-world data, and see how engineers address incredible and important design challenges through the use of linear modeling. Student groups act as engineering teams by conducting experiments to collect data and model the relationship between the wall thickness of the latex tubes and their corresponding strength under pressure (to the point of explosion). Students learn to graph variables with linear relationships and use collected data from their designed experiment to make important decisions regarding the feasibility of hydraulic systems in hybrid vehicles and the necessary tube size to make it viable.
No restrictions on your remixing, redistributing, or making derivative works. Give credit to the author, as required.
Your remixing, redistributing, or making derivatives works comes with some restrictions, including how it is shared.
Your redistributing comes with some restrictions. Do not remix or make derivative works.
Most restrictive license type. Prohibits most uses, sharing, and any changes.
Copyrighted materials, available under Fair Use and the TEACH Act for US-based educators, or other custom arrangements. Go to the resource provider to see their individual restrictions.