Students apply high school-level differential calculus and physics to the design of …
Students apply high school-level differential calculus and physics to the design of two-dimensional roller coasters in which the friction force is considered, as explained in the associated lesson. In a challenge the mirrors real-world engineering, the designed roller coaster paths must be made from at least five differentiable functions that are put together such that the resulting piecewise curving path is differentiable at all points. Once designed mathematically, teams build and test small-sized prototype models of the exact designs using foam pipe wrap insulation as the roller coaster track channel with marbles as the ride carts.
The aim of this unit is that upon completion, teachers will be …
The aim of this unit is that upon completion, teachers will be able to use ICT to support class administration through the keeping of a digital class record system using a spreadsheet package.
Quantitative Research Methods for Political Science, Public Policy and Public Administration for …
Quantitative Research Methods for Political Science, Public Policy and Public Administration for Undergraduates: 1st Edition With Applications in Excel is an adaption of Quantitative Research Methods for Political Science, Public Policy and Public Administration (With Applications in R). The focus of this book is on using quantitative research methods to test hypotheses and build theory in political science, public policy and public administration. This new version is designed specifically for undergraduate courses. It omits large portions of the original text that focused on calculus and linear algebra, expands and reorganizes the content on the software system by shifting to Excel and includes guided study questions at the end of each chapter.
Students are introduced to the technology of flexible circuits, some applications and …
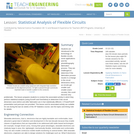
Students are introduced to the technology of flexible circuits, some applications and the photolithography fabrication process. They are challenged to determine if the fabrication process results in a change in the circuit dimensions since, as circuits get smaller and smaller (nano-circuits), this could become very problematic. The lesson prepares students to conduct the associated activity in which they perform statistical analysis (using Excel® and GeoGebra) to determine if the circuit dimension sizes before and after fabrication are in fact statistically different. A PowerPoint® presentation and post-quiz are provided. This lesson and its associated activity are suitable for use during the last six weeks of the AP Statistics course; see the topics and timing note for details.
Students apply pre-requisite statistics knowledge and concepts learned in an associated lesson …
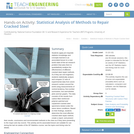
Students apply pre-requisite statistics knowledge and concepts learned in an associated lesson to a real-world state-of-the-art research problem that asks them to quantitatively analyze the effectiveness of different cracked steel repair methods. As if they are civil engineers, students statistically analyze and compare 12 sets of experimental data from seven research centers around the world using measurements of central tendency, five-number summaries, box-and-whisker plots and bar graphs. The data consists of the results from carbon-fiber-reinforced polymer patched and unpatched cracked steel specimens tested under the same stress conditions. Based on their findings, students determine the most effective cracked steel repair method, create a report, and present their results, conclusions and recommended methods to the class as if they were presenting to the mayor and city council. This activity and its associated lesson are suitable for use during the last six weeks of the AP Statistics course; see the topics and timing note for details.
Working as if they are engineers aiming to analyze and then improve …
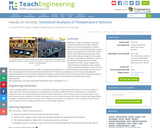
Working as if they are engineers aiming to analyze and then improve data collection devices for precision agriculture, students determine how accurate temperature sensors are by comparing them to each other. Teams record soil temperature data during a class period while making changes to the samples to mimic real-world crop conditions—such as the addition of water and heat and the removal of the heat. Groups analyze their collected data by finding the mean, median, mode, and standard deviation. Then, the class combines all the team data points in order to compare data collected from numerous devices and analyze the accuracy of their recording devices by finding the standard deviation of temperature readings at each minute. By averaging the standard deviations of each minute’s temperature reading, students determine the accuracy of their temperature sensors. Students present their findings and conclusions, including making recommendations for temperature sensor improvements.
Students build on their existing air quality knowledge and a description of …
Students build on their existing air quality knowledge and a description of a data set to each develop a hypothesis around how and why air pollutants vary on a daily and seasonal basis. Then they are guided by a worksheet through an Excel-based analysis of the data. This includes entering formulas to calculate statistics and creating plots of the data. As students complete each phase of the analysis, reflection questions guide their understanding of what new information the analysis reveals. At activity end, students evaluate their original hypotheses and “put all of the pieces together.” The activity includes one carbon dioxide worksheet/data set and one ozone worksheet/data set; providing students and/or instructors with a content option. The activity also serves as a good standalone introduction to using Excel.
No restrictions on your remixing, redistributing, or making derivative works. Give credit to the author, as required.
Your remixing, redistributing, or making derivatives works comes with some restrictions, including how it is shared.
Your redistributing comes with some restrictions. Do not remix or make derivative works.
Most restrictive license type. Prohibits most uses, sharing, and any changes.
Copyrighted materials, available under Fair Use and the TEACH Act for US-based educators, or other custom arrangements. Go to the resource provider to see their individual restrictions.