Updating search results...

Search Resources

43 Results

View
Selected filters:
  • census
Local to Global: The Sociological Journey
Conditional Remix & Share Permitted
CC BY-NC-SA
Rating
0.0 stars

This textbook is a massive long term collaboration between sociologists who want to lessen the cost of higher education for students like you. This book is originally written by a sociologist at the University of Maine, and the textbook publisher for his many other books doesn’t want his name associated with free work… frustrating but not surprising. The sociology faculty at Lansing Community College secured an editable version and worked to provide a more current version in 2018. Their data analysis from the 2016 General Social Survey and from the Standard Cross-Cultural Sample is included in the text. Then in 2020 the sociology faculty at Delta College produced the online version of the book, updated the Census Data to the most recent 2018 American Community Survey and updated the 2017-2020 data from the World Values Survey. Additional editing for readability, a global to local focus, and modern context is underway. This text is a work in progress, and your questions and feedback make it more relevant and relatable.

Subject:
Social Science
Sociology
Material Type:
Textbook
Author:
Christina Miller-bellor
Donna Giuliani
Date Added:
03/02/2021
Maps and Graphs - Exploring the U.S. Island Territories
Unrestricted Use
Public Domain
Rating
0.0 stars

Students will examine data from the 1990–2010 censuses — and U.S. Census Bureau projections for 2010–2020 — on population changes in the U.S. island territories to make observations about the populations’ demographics and to make inferences about the purpose of such data.

Subject:
Mathematics
Statistics and Probability
Material Type:
Activity/Lab
Provider:
U.S. Census Bureau
Provider Set:
Statistics in Schools
Date Added:
10/18/2019
The Missouri Compromise - A Primary Source Analysis
Unrestricted Use
Public Domain
Rating
0.0 stars

Students will examine tables of data from the 1820 Census to understand the implications of the Missouri Compromise, specifically in Maine and Missouri.

Subject:
Mathematics
Statistics and Probability
Material Type:
Activity/Lab
Provider:
U.S. Census Bureau
Provider Set:
Statistics in Schools
Date Added:
10/15/2019
Missouri Compromise – Free vs. Slave States
Unrestricted Use
Public Domain
Rating
0.0 stars

The purpose of this activity is to introduce students to the Missouri Compromise and the issues associated with the expansion of slavery in the Antebellum period of United States history. Students will begin the activity by creating a map that represents the Missouri Compromise’s impact on the United States. This map will serve as a backdrop for the activity while introducing students to political and cultural sectionalism (northern and southern states and the issue of slavery) in the early 1800s. After students complete the map, they will answer several questions using it. Students will also be prompted to examine aggregated data from the 1820 Census and a map titled “Mapping Slavery in the Nineteenth Century” to make comparisons and draw conclusions about slavery, specifically in Missouri.

Subject:
Mathematics
Statistics and Probability
Material Type:
Activity/Lab
Provider:
U.S. Census Bureau
Provider Set:
Statistics in Schools
Date Added:
10/16/2019
The Modern Family:Changes in Structure and Living Arrangements in the United States
Unrestricted Use
Public Domain
Rating
0.0 stars

Students will learn why families are important social institutions and how family structures, household sizes, and living arrangements have changed substantially since the 1970s. In part 1, students will work in groups of three to four to analyze census data so that they may understand these changes. In part 2, students will watch a clip from the show “Modern Family” and compare their observations with census data.

Subject:
Mathematics
Statistics and Probability
Material Type:
Activity/Lab
Provider:
U.S. Census Bureau
Provider Set:
Statistics in Schools
Date Added:
10/18/2019
Narratives and Names
Unrestricted Use
Public Domain
Rating
0.0 stars

This activity serves as an introduction to a narrative writing assignment. To provide context for this activity, teachers will give students an overview of the Census Bureau. Then, students will complete a Quickwrite about their name and its history. After that, students will examine and answer questions about census data on popular last names, listen to a story about names, and complete a Quickwrite about that story. To further prepare for their narrative writing assignment about names (which is not part of this activity), students will jot down their thoughts in a graphic organizer.

Subject:
Mathematics
Statistics and Probability
Material Type:
Activity/Lab
Provider:
U.S. Census Bureau
Provider Set:
Statistics in Schools
Date Added:
10/18/2019
Numbers That Tell a Story
Unrestricted Use
Public Domain
Rating
0.0 stars

Using State Facts for Students, a data access tool from the U.S. Census Bureau, students will explore data about their state and voice their opinions on how the population has changed over time. Students will work in small groups to share their opinions, practicing oral communication and small-group discussion skills.

Subject:
Mathematics
Statistics and Probability
Material Type:
Activity/Lab
Provider:
U.S. Census Bureau
Provider Set:
Statistics in Schools
Date Added:
10/18/2019
Perceptions of a Place: Los Angeles, California
Unrestricted Use
Public Domain
Rating
0.0 stars

This activity will help students understand that people’s perceptions of the world—places, regions, and environments—are constantly changing with new experiences and information. Students will examine Census Bureau data about Los Angeles, and about the rest of California and the United States, to challenge or confirm these perceptions.

Subject:
Mathematics
Statistics and Probability
Material Type:
Activity/Lab
Provider:
U.S. Census Bureau
Provider Set:
Statistics in Schools
Date Added:
10/18/2019
The Place of My State
Unrestricted Use
Public Domain
Rating
0.0 stars

Students will use a U.S. Census Bureau data tool called State Facts for Students to analyze the population data of their state. They will write the data in several forms, round the numbers, and then compare their state’s population with that of a nearby state.

Subject:
Mathematics
Statistics and Probability
Material Type:
Activity/Lab
Provider:
U.S. Census Bureau
Provider Set:
Statistics in Schools
Date Added:
10/15/2019
Population Density from the First Census, 1790
Read the Fine Print
Educational Use
Rating
0.0 stars

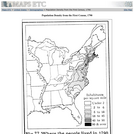
A map of the eastern United States in 1790 showing the western extent of the territories to the Mississippi, and the distribution of European–American population at the time. The map is keyed to show areas of population densities ranging from under 2 inhabitants per square mile to areas with 90 or more inhabitants per square mile.

Subject:
History
U.S. History
Material Type:
Diagram/Illustration
Primary Source
Provider:
University of South Florida
Provider Set:
Educational Technology Clearinghouse
Date Added:
03/24/2014
Population Profile of Our New Nation: A Comparison of the 1790 and 1800 Censuses
Unrestricted Use
Public Domain
Rating
0.0 stars

In this activity, students will refer to the 1790 and 1800 Censuses to compare the total population with the population of enslaved people, drawing conclusions from the data.

Subject:
Mathematics
Statistics and Probability
Material Type:
Activity/Lab
Provider:
U.S. Census Bureau
Provider Set:
Statistics in Schools
Date Added:
10/16/2019
Post-World War II Globalization - U.S. Citizens Living Overseas
Unrestricted Use
Public Domain
Rating
0.0 stars

Students will analyze the 1950 Census form for Americans living overseas and 1910–1990 census data for these Americans to understand the impact of the Cold War on the number of U.S. citizens living abroad.

Subject:
Mathematics
Statistics and Probability
Material Type:
Activity/Lab
Provider:
U.S. Census Bureau
Provider Set:
Statistics in Schools
Date Added:
10/18/2019
Quantitative Reasoning & Statistical Methods for Planners I
Conditional Remix & Share Permitted
CC BY-NC-SA
Rating
0.0 stars

This course develops logical, empirically based arguments using statistical techniques and analytic methods. Elementary statistics, probability, and other types of quantitative reasoning useful for description, estimation, comparison, and explanation are covered. Emphasis is on the use and limitations of analytical techniques in planning practice.

Subject:
Mathematics
Social Science
Material Type:
Full Course
Provider Set:
MIT OpenCourseWare
Author:
Glenn, Ezra
Date Added:
02/01/2009
Spatial Data Analytics for Transportation
Conditional Remix & Share Permitted
CC BY-NC-SA
Rating
0.0 stars

Do you know how important GIS is to the transportation industry? The spatial applications to this field are so extensive that they represent an entire sub-discipline within the GIS community. In this course, we'll learn about the primary modes of transportation and explore some of the spatial applications developed to meet the unique needs of each. We'll also take a close look at some key organizations in the industry and learn firsthand from more than a dozen transportation professionals about the role GIS plays for them. Throughout the course, we'll study GIS concepts and techniques that are fundamental to transportation and get hands-on experience with tools such as Esri's Network Analyst and Esri's Roads and Highways.

Subject:
Applied Science
Career and Technical Education
Information Science
Logistics and Transportation
Material Type:
Full Course
Provider:
Penn State College of Earth and Mineral Sciences
Author:
JD Kronicz
Date Added:
10/07/2019
Spatial Database Management and Advanced Geographic Information Systems
Conditional Remix & Share Permitted
CC BY-NC-SA
Rating
0.0 stars

This semester long subject (11.521) is divided into two halves. The first half focuses on learning spatial database management techniques and methods and the second half focuses on using these skills to address a ‘real world,’ client-oriented planning problem. The first half of the semester may be taken separately using the class number 11.523 and the second half may be taken separately as 11.524.
In order to help shape and utilize the information infrastructure that will support the management and development of our metropolitan areas, planners need a basic understanding of the tools and technology for querying, analyzing, and sharing complex databases and maps. Managing online access to large and constantly-changing spatial datasets can be a powerful aid to planning and can facilitate inter-agency cooperation and collaboration in an increasingly decentralized world. But it requires the use of knowledge representation methods, client-server technologies and access control issues that are quite different from what are needed to model and visualize standalone datasets on a personal computer. Hence, planners should acquire basic skills in database management, digital spatial data analysis, and networking.
The 11.523 portion of the semester addresses these issues while retaining a focus on planning (rather than on computer science). This is an intensive, hands-on class that stresses learning by doing. Exercises and examples involving real-world data, maps, and images are used to develop skills with database query languages and the design development and use of structured databases. Class work utilizes web tools, GIS, and database software with lab exercises primarily on the new high-performance PC computing cluster. Specifically, we will access an Oracle 8i database using SQL (structured query language) and use ArcView for GIS. Each week there are two sixty to ninety-minute classes plus another 90+ minute hands-on lab in electronic classrooms. Class lectures will focus on concepts and case discussion, the scheduled lab time focuses on computer mechanics and skill building. Specific topics during 11.523 include:

finding, understanding and structuring digital spatial data that are available on the Internet using various browsing, visualization, and data management tools;
considerable work with relational database technologies and the Structured Query Language (SQL) to design, construct, query, and update urban planning databases;
some experience with so-called ‘client/server’ and ’enterprise GIS’ technologies for facilitating distributed access to complex spatial data and urban planning applications;
advanced GIS topics such as 3D visualizations and geospatial web services.

The 11.524 portion of the semester will treat the classroom like a professional planning office, working as a team to produce a two deliverables for their client, Lawrence Community Works, Inc. (LCW), a community development corporation located in the City of Lawrence, Massachusetts. LCW and DUSP recently agreed to work together for the next five years to design and implement a multi-tier web-based planning system that promotes democratic involvement and informs community development projects. Your involvement this semester is critical, because the implementation plan that you craft this semester will serve as the road map for both organizations for years to come and the simple web-based planning tool that you design will engage stakeholders by giving them a better sense of how technologies can aid decision-making processes. To assist you with the more technical aspects of the project, we hired Robert Cheetham, President of Azavea, Inc. (http://www.azavea.com/ ), to provide exactly 100 hours of consultancy services. Through their project work, students will enhance important professional skills by:

formulating an implementation plan for a real client;
designing a simple web-based tool for understanding problems;
engaging constituents and stakeholders in a real setting;
integrating theory and practice by evaluating the role of technology in community development;
learning to communicate effectively within a group and with a professional consultant;
working with such tools as the WWW, Access, ArcView, ArcIMS, SDE, etc.

Subject:
Applied Science
Computer Science
Engineering
Social Science
Sociology
Material Type:
Full Course
Provider Set:
MIT OpenCourseWare
Author:
Ferreira, Joseph
Hoyt, Lorlene
Date Added:
02/01/2003
United States Population Density, 1900
Read the Fine Print
Educational Use
Rating
0.0 stars

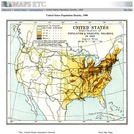
A map from 1912 of the United States, subtitled "Distribution of Population and Railways in 1900" showing the increase in population and expansion of the railroad network since 1850. The map is color–coded to show population densities ranging from areas with fewer than 2 inhabitants per square mile to areas of 90 or more inhabitants per square mile. Cities with populations over 8,000 are shown with circles proportionate to their populations at the time. The map shows the westward progression of the mean centers of population from 1790 to 1900.

Subject:
History
U.S. History
Material Type:
Diagram/Illustration
Primary Source
Provider:
University of South Florida
Provider Set:
Educational Technology Clearinghouse
Date Added:
03/24/2014
Using Interactive Maps to Interpret U.S. Territorial Expansion
Unrestricted Use
Public Domain
Rating
0.0 stars

Students will explore an interactive data visualization of state-by-state population growth as measured by the decennial censuses of 1790 through 2010. Students will also analyze and make inferences about the causes of more recent shifts in U.S. population.

Subject:
Mathematics
Statistics and Probability
Material Type:
Activity/Lab
Provider:
U.S. Census Bureau
Provider Set:
Statistics in Schools
Date Added:
10/15/2019
Using the Decennial Census to Draw Conclusions About American Life
Unrestricted Use
Public Domain
Rating
0.0 stars

Students will examine questions from 1940, 1960, and 2010 census questionnaires to analyze socioeconomic changes in the U.S. population before and after World War II.

Subject:
Mathematics
Statistics and Probability
Material Type:
Activity/Lab
Provider:
U.S. Census Bureau
Provider Set:
Statistics in Schools
Date Added:
10/18/2019
What Role Does Geography Play in the Census?
Unrestricted Use
Public Domain
Rating
0.0 stars

Students will learn about and review key geography and census terms, discover how the U.S. Census Bureau organizes space geographically, and understand why census data are collected in this way.

Subject:
Mathematics
Statistics and Probability
Material Type:
Activity/Lab
Provider:
U.S. Census Bureau
Provider Set:
Statistics in Schools
Date Added:
10/18/2019