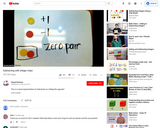
This is an instructional video demonstrating how to subtract integers using colored chips to visually represent the subtraction rule of adding the opposite.
- Subject:
- Mathematics
- Material Type:
- Lecture
- Author:
- Cheryl Erickson
- Date Added:
- 12/10/2013

This is an instructional video demonstrating how to subtract integers using colored chips to visually represent the subtraction rule of adding the opposite.
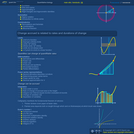
The purpose of the first part of this video is to introduce the idea of summation and its notation using the Greek-letter Sigma. We practice working with sums by using Gauss's summation trick. In the second part of the video, we study examples of infinite series, one which converges to a finite number (geometric series), and one which diverges (harmonic series).

An introduction and examples of how to use Survival analysis and Life event analysis. This is about statistical methods for analyzing longitudinal data on the occurrence of events. Events may include death, injury, marriage, getting a job (binary variables).
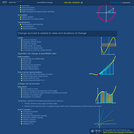
To continue our discussion of derivatives from preceding videos, we explain that the second derivative represents curvature. By combining knowledge of multiple derivatives, we can sometimes create Taylor series, which are local approximations of functions. As an example, we Taylor-expand sinusoidal functions and then use the results to iteratively approximate pi.

How can the language you use and the stories you tell encourage and engage girls and women in STEM subjects? Explore techniques for fostering an inclusive environment in the STEM classroom.

Learn about the distance to the ISS using a simple scale modeling activity, then challenge yourself and your students to build their own robotic arm with materials from home.
Real World Slope HyperDoc lesson. This HyperDoc lesson engages students in real world applications of slope. They will also engage in utlizing OER resources as they remix some of their own.

Nebraska Public Media and PBS have curated FREE, curriculum-aligned videos, interactives, lesson plans, and more for teachers like you.
This guide is intended for all instructors and course designers who use the Canvas learning management system. It will help them identify which Canvas tool is suited for a particular teaching goal.
This is an online set of information about astronomical alignments of ancient structures and buildings. Learners will read background information about the alignments to the Sun in such structures as the Great Pyramid, Chichen Itza, and others. Next, the site contains 10 short problem sets that involve a variety of math skills, including determining the scale of a photo, measuring and drawing angles, plotting data on a graph, and creating an equation to match a set of data. Each set of problems is contained on one page and all of the sets utilize real-world problems relating to astronomical alignments of ancient structures. Each problem set is flexible and can be used on its own, together with other sets, or together with related lessons and materials selected by the educator. This was originally included as a folder insert for the 2010 Sun-Earth Day.

Teilspielperfektes Nash-GG
Thingfully is a growing platform of lesson plans for the Internet of Things.
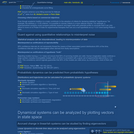
Students will learn a sample-variance curve fitting method that can be used to determine whether a set of experimental data appears to have been generated by a model. This method is based on minimizing the reduced chi-squared value. This video includes a reminder to inspect normalized residuals before reporting fitted parameters.
The quadrature formula relates the fluctuations of a function to fluctuations in the variables on which the function depends. In this derivation, we approximate a multivariable function using a Taylor expansion, and we assume that fluctuations in the underlying variables are statistically independent, which allows us to apply an identity previously derived in the unit on statistics. Namely, "variances of sums are sums of variances" for variables that fluctuate independently.
In the first video segment, we estimate properties of a parent distribution (i.e. mean and standard deviation) from a sample of a finite collection of data measurements, and we describe the standard error (SE). In the second segment, we derive the famous square-root of n factor that appears in the SE formula. The third video segment describes the visual comparison of error bars, and the fourth segment warns against a mistake that can generate inappropriate claims of statistical significance during this kind of analysis.
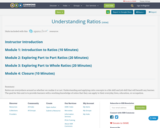
Ratios are everywhere around us whether we realize it or not. Understanding and applying ratio concepts is a life skill and job skill that will benefit any learner. The goal for this unit is to provide learners with a working knowledge of ratios that they can apply to their everyday lives, education, or occupation.
The goal of these lessons is for students to be able to write expressions from word phases, write algebraic equations to represent real-world scenarios, and match linear expressions to word problems. Often students are able to figure out the solutions to mathematical concepts taught in isolation, but are challenged when ask to explain what the answer means in the context of a word problem. This lesson is designed to teach students the relevance of their mathematic answer. Before introducing this lesson, think about some real world relevant examples where the algebraic equations would assist the students in their everyday lives. Have these ready to address the issue of relevance in students’ lives.
This guide outlines various OER resources available to utilize the Area Model in the Mathematics classroom. The guide is intended to help Adult Education and Community College Instructors learn and utilize more visual approaches in the math classroom. However, many of the resources are Common Core aligned, and are therefore appropriate for k-12 use as well.
Planning for the future is a difficult task for most. This lesson ask the learner to participate in role-play and to assume the role of someone who has just graduated and accepted a job and to develop a budget where the goal is to save for a vacation to be taken in a year’s time. The role that the learner is asked to assume is Madison. The name was chosen specifically because it is a unisex name. The character, Madison, has just graduated, but the story intentionally does not reveal the credential that was achieved. The learner is asked to develop a budget with the salary and withheld taxes already established. For learners living in a rural area, the salary may seem high for a recent graduate, but for a learner from an urban area, the salary may seem low. Along with assuming this identity comes the tasks of making decisions for him/her. The actual math problems have definitive answers which are provided for the instructor, but the decisions enable the learner to develop a unique budget. Unit rate is used to help the learner visualize the decisions that are made on a daily basis that may impact savings. Problems included ask the learner to make decisions about housing, transportation, health, and spending. The variety of problems enable the learner to compute unit rates and understand how quantities can be measured in different units. The instructor is a facilitator only, examples of calculations are included in the materials for guidance.

Students will gather information and data about vaccine information. They will use this information to argue whether or not vaccinations should be mandatory, culminating in a summative assessment in the form of a debate and a reflection on the information gathered.