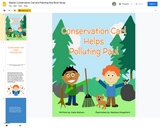
This book was written as a collaborative effort from a group of …
This book was written as a collaborative effort from a group of 5 high school students. Their goal is to inform everyone how to make positive changes to impact our environment and especially our water sources.
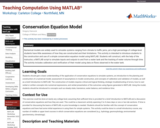
Numerical models are widely used to simulate systems ranging from climate to …
Numerical models are widely used to simulate systems ranging from climate to traffic jams, yet a high percentage of college-level students have little awareness of how they are constructed and their limitations. This activity is intended to introduce students to the construction and use of a simple conservation equation model using MATLAB. Students will construct, with the help of the instructor, a MATLAB script to simulate inputs and outputs to and from a water tank and the tracking of water volume through time. The activity includes calibration and verification of their model using data on flows observed in the water tank.
(Note: this resource was added to OER Commons as part of a batch upload of over 2,200 records. If you notice an issue with the quality of the metadata, please let us know by using the 'report' button and we will flag it for consideration.)
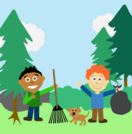
This lesson allows students the opporutunity to learn through hands-on investigation how …
This lesson allows students the opporutunity to learn through hands-on investigation how to help our water sources one small change at a time. Journey with Pollution Paul and Conservation in a fun interactive story, then have fun working through the lab simulation. Don't forget to learn all about Algal Blooms with the informational Document. Aligned to Utah State SeeD Standards and Next Generation Science Standards. Although this was created for the elementary age level, it can easily be adapted to middle school and even high school.
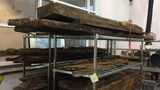
This video resource is presented as a real-world application of chemistry in …
This video resource is presented as a real-world application of chemistry in the field of conservation archaeology. Conservator, Francis Lukezic, walks through the conservation practices for waterlogged archaeological wood and explains the chemical and cellular processes at work. Use to support Maryland/NGSS for Grades 5, MS, and HS. For 5-PS1-1 and MS-PS1-1, have students watch or perform the paper clip demonstration and discuss how the hydrogen bonding of water allows this then is disrupted by the soap; have students develop diagrams explaining the phenomenon of surface tension on the molecular level. For HS-PS2-6, have students watch or perform the sponge demonstration and discuss how the molecular structure of the wood makes it vulnerable to becoming waterlogged then brainstorm materials that are more resilient to water and discuss the uses of the materials. For interdisciplinary connections to geography and history, have students research why Maryland archaeologists do or do not discover the materials brainstormed instead of wood. If you evaluate or use this resource, please respond to this short (4 question) survey bit.ly/3DhRumA
This assignment is meant to illustrate how the advection of heat by …
This assignment is meant to illustrate how the advection of heat by groundwater leads to the elevated temperatures at shallow sedimentary basin margins at which Mississippi Valley-type Zn-Pb hydrothermal ore deposits are formed. The assignment is based on analytical solutions for groundwater flow and heat transport published by Domenico & Palciauskas (1973). Students use a spreadsheet to calculate and plot the flow field and temperature in a sedimentary basin, and to investigate the conditions needed to produce ore-forming temperatures. These results have further implications for the length of time available for ore formation and the concentration of metals and pH of the groundwater, which are also explored in the assignment. The assignment provides an example of how groundwater plays a fundamental role in an important geologic process in the Earth's crust. The activity also shows the linkages of hydrology to other disciplines such as heat transport, geochemistry, and economic geology.
(Note: this resource was added to OER Commons as part of a batch upload of over 2,200 records. If you notice an issue with the quality of the metadata, please let us know by using the 'report' button and we will flag it for consideration.)
This design challenge moves your students from passive to active learners through …
This design challenge moves your students from passive to active learners through a cross-curricular, hands-on team challenge in direct correlation to real-world issues of water conservation. In this lesson, students, grades 6-8, will learn about aqueducts through a close reading activity. They are then given different scenarios in an engineering design challenge to create an aqueduct to supply freshwater to their city, despite various obstacles.
In this bottle rockets lesson, students learn the basic principles of rocketry …
In this bottle rockets lesson, students learn the basic principles of rocketry and Newton’s Third Law through a hands-on activity. They design and construct rockets using plastic bottles, adding nose cones and fins to understand how these elements affect flight. After filling their rockets with water and using a pump to build pressure, they launch their rockets and observe the results. The lesson concludes with a discussion on how their designs influenced the rockets' stability and flight path.
Students create a water table map and flow net using water level …
Students create a water table map and flow net using water level data from seepage lakes in the Sand Hills of Nebraska. They then are able to make hypotheses regarding the chemistry of the lakes.
(Note: this resource was added to OER Commons as part of a batch upload of over 2,200 records. If you notice an issue with the quality of the metadata, please let us know by using the 'report' button and we will flag it for consideration.)
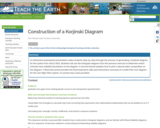
An interactive powerpoint presentation walks students step-by-step through the process of generating …
An interactive powerpoint presentation walks students step-by-step through the process of generating a Korjinski diagram for the system K20-Al2O3-SiO2. Students will use the triangular diagram from the previous exercise to determine which minerals have stability boundaries on the diagram. A second tutorial explains how to plot a natural water composition on the diagram. A Word document provides the thermodynamic data and instructions necessary to create their own diagram for the Ca0-MgO-SiO2 system. An answer key is also provided.
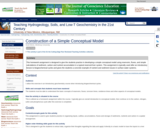
This homework assignment is designed to give the students practice in developing …
This homework assignment is designed to give the students practice in developing a simple conceptual model using reservoirs, fluxes, and simple calculations of sediment, carbon and nutrient accumulation in a typical reservoir/river system. This assignment is typically used after an introductory lecture to biogeochemical cycles and gives the students a concrete example of nutrient and sediment issues in surface water systems.
(Note: this resource was added to OER Commons as part of a batch upload of over 2,200 records. If you notice an issue with the quality of the metadata, please let us know by using the 'report' button and we will flag it for consideration.)
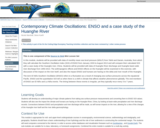
This module uses data of monthly mean sea level pressure from Tahiti …
This module uses data of monthly mean sea level pressure from Tahiti and Darwin, Australia to calculate the Southern Oscillation Index (SOI) of El Nino-Southern Oscillation (ENSO) for comparison with the Huanghe River (China) discharge and correlated anthropogenic effects.
Dr. Royce observes a lesson on water evaporation in Ms. Maronpots class, …
Dr. Royce observes a lesson on water evaporation in Ms. Maronpots class, gives her feedback, and visits again one week later. See the changes Ms. M makes in her lesson before and after the visit.
This activity proposes different small experiments and discussions to show that in …
This activity proposes different small experiments and discussions to show that in the summer it is cooler by the sea than on the land and that water cools off more slowly than soil.
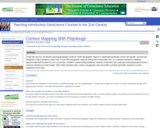
Students measuring elevations in a model map area. Provenance: Lynne Elkins, University …
Students measuring elevations in a model map area.
Provenance: Lynne Elkins, University of Nebraska at Lincoln Reuse: This item is offered under a Creative Commons Attribution-NonCommercial-ShareAlike license http://creativecommons.org/licenses/by-nc-sa/3.0/ You may reuse this item for non-commercial purposes as long as you provide attribution and offer any derivative works under a similar license. This exercise was designed in a department that has some basic support for developing inexpensive classroom equipment in cooperation with a machine shop. The shop built gridded mapping frames to my specifications using a simple aluminum design (a square frame of aluminum with small pins inserted at one-inch intervals). An even simpler DIY design could use thin but sturdy pieces of wood to create a wooden frame, with steel nails. My initial design called for 2'x2' frames, which turned out to be too large: mapping a 4 sq. ft. space at 1-inch resolution took more than a standard lab period for most students to complete. The attached exercise instructs students to use a smaller portion of the mapping grid; this can be revised for different size grids. Another issue to be aware of when designing mapping grid frames is whether to label the spaces with letters and numbers (as is done on many maps and was thus my original thinking) or to label the lines between the spaces, which is easier for data collection.
At the start of the lab, I typically give my students a few ground rules: they should avoid extremely flat areas, because the elevation rounding they are likely to do will make contouring them very difficult; their highest point should be at least 2 inches and not more than 4-5 inches high; they may not have vertical walls or overhangs (and should really keep the slopes less than 60-70Â at their steepest); the table surface is sea level with zero elevation; and most of their model area must be mappable land (not ocean, i.e. bare table). I give them large sheets of wax paper to construct the model on, for easy cleanup. I also provide large sheets of 1" grid paper so they can create a 1:1 map of their model (and I impose a scale calculation later for the model), and remind them several times not to invert the map labels when setting up their map grid. Typically this is all they need to know to begin creating and mapping a landscape. The mapping tools are pieces of string (to string across the pins on the mapping frames and position the grid points) and wooden skewers labeled with quarter-inch markings.
After an initial attempt to make the playdough for this lab, my department opted to purchase 6-lb. tubs of commercial playdough. It is ultimately relatively inexpensive because it is reusable almost indefinitely, as long as it is stored tightly sealed (we use zip-loc bags inside the commercial containers) and occasionally spritzed with water--once a year usually works fine for keeping it hydrated for storage over the rest of the year, but that may vary with climate and frequency of use. Typically I walk around while they are getting started and make commentary on their landscapes, and then when there are no further questions I go to the board and create an example data set and contour map. While a photocopied paper example map would accomplish the same thing, this approach lets me tailor my examples to what I see they are doing (e.g., including circular depressions, saddles, or ridges). I also have handy and frequently refer the students to USGS quads from around the country when they are mapping, e.g. a very flat quad with depressions in central Florida and a very steep quad from the Grand Canyon.
When they are mapping, I typically advise them to 1) sketch in the shoreline around their zero-elevation values by comparing to the model, 2) add major peaks between grid lines as needed, and 3) map from the highest parts of their map area downward. I also discourage contour intervals smaller than 1/2-inch, particularly when their model contains flat terrain. Many students want to be more precise, and if they have estimated depths to the nearest 1/8-inch it is possible to contour at 1/4-inch intervals, but typically their rounded measurements in flat areas make this quite tricky. It often is necessary for me (and/or TAs) to walk around and give them advice in places they are stuck and remind them how contours work.
Making the profile is usually very quick. The graph provided would need to be adjusted/replaced for different size mapping grids, but works well for a grid that runs from A to O on one side and from 1 to 10+ on the other.
If they are kept on task everyone except the most cautious or disorganized groups can typically finish elevation measurements for about 2 sq. ft. of map area within 1.5 hours. With an introductory spiel, that leaves about an hour for finishing most of the contouring and transferring data for the profile. Faster groups will probably finish all the final details but are well-advised to take the lab home to double check the details. Slower groups may finish coloring and looking at the local topo map on their own. Longer lab periods would permit a more detailed study of the local USGS maps and/or a larger model size--this was written for a 3-hour lab period.
(Note: this resource was added to OER Commons as part of a batch upload of over 2,200 records. If you notice an issue with the quality of the metadata, please let us know by using the 'report' button and we will flag it for consideration.)
In this activity, learners make their own heat waves in an aquarium. …
In this activity, learners make their own heat waves in an aquarium. Warmer water rising through cooler water creates turbulence effects that bend light, allowing you to project swirling shadows onto a screen. Use this demonstration to show convection currents in water as well as light refraction in a simple, visually appealing way.
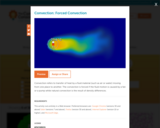
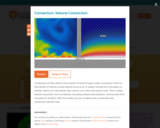
Convection refers to transfer of heat by a fluid material (such as …
Convection refers to transfer of heat by a fluid material (such as air or water) moving from one place to another. The convection is forced if the fluid motion is caused by a fan or a pump while natural convection is the result of density differences.
Conduction of heat refers to the transfer of heat through a solid. …
Conduction of heat refers to the transfer of heat through a solid. Convection refers to the transfer of heat by a fluid material (such as air or water) moving from one place to another. Warm air is less dense than cold air, so it rises and cold air sinks. This is called natural convection. Air is constantly circulating indoors and outdoors, moving heat from one place to another. With this model you can compare how conduction and convection transfer heat.
This video segment adapted from the Atmospheric Radiation Program explains the differences …
This video segment adapted from the Atmospheric Radiation Program explains the differences in the formation of tropical convective cloud systems over islands and over the ocean.
In this edition, UC Berkeley's Harry Kreisler talks with UC Berkeley Professor …
In this edition, UC Berkeley's Harry Kreisler talks with UC Berkeley Professor Roy L. Caldwell about his work in marine biology and what his research tells us about sight in stomatopods. (51 min)
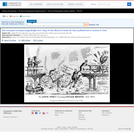
A cartoon on the defeat of Whig Henry Clay in the 1844 …
A cartoon on the defeat of Whig Henry Clay in the 1844 presidential election, ascribing his loss of the state of New York to his cousin Cassius M. Clay's campaign tour on his behalf. Oddly, though given prominence in the title, Cassius M. Clay does not appear in the picture itself. As Clay and his running mate Theodore Frelinghuysen--each having raccoon bodies--cross a bridge, it collapses in pieces, spilling Clay and his entourage of raccoons and starving dogs into the river. Clay grasps Frelinghuysen's tail and says, "Hold on Vice Frelinghuysen I have not only lost my election, I fear my principles are leaking out and will be exposed to the gaze of the Common people." From his open abdomen fall pistols, playing cards, and dice, evidence of his penchant for dueling and gambling. Freylinghusen responds: "Oh! Great Henry this is the effect of keeping bad Company. I think YOU are about the right material for a Vice President. I advise you to study Divinity it is your only hope left." (Frelinghuysen was a prominent churchman.) Assorted exclamations come from the hapless animals, one of whom cries, "help me Casius or I sink." On the section of the bridge at right several roosters holding brooms (symbolizing reform) jeer at the two candidates, the largest one saying, "Humbug has had its days." Below the roosters, in the distance, a crowd dances around a flagpole with a banner inscribed "Oregon" and "Texas." Further on, a fortress with a flag "Our Thunder" fires one of its guns. Standing on the left side of the bridge are two Pennsylvanians. One says, "Did you hear the news from New York-York York all honest & true" and the other, "Oh! give us Polk & Dallas how happy we will be . . . ." In the water below, a boat marked "Make way for Gov. Shunk" rows by with three men aboard. One man in the boat, possibly newly elected Democratic governor of Pennsylvania Francis R. Shunk, observes of Clay, "that large Coon has very black Legs I reckon." "Blackleg" was common slang for scoundrel. |Entered . . . 1845 by Wm. Dohnert . . . E. District of Penn.|Title appears as it is written on the item.|Weitenkampf, p. 85.|Forms part of: American cartoon print filing series (Library of Congress)|Published in: American political prints, 1766-1876 / Bernard F. Reilly. Boston : G.K. Hall, 1991, entry 1845-1.
No restrictions on your remixing, redistributing, or making derivative works. Give credit to the author, as required.
Your remixing, redistributing, or making derivatives works comes with some restrictions, including how it is shared.
Your redistributing comes with some restrictions. Do not remix or make derivative works.
Most restrictive license type. Prohibits most uses, sharing, and any changes.
Copyrighted materials, available under Fair Use and the TEACH Act for US-based educators, or other custom arrangements. Go to the resource provider to see their individual restrictions.