The Coke vs. Pepsi Taste Test Challenge has students design and carry …
The Coke vs. Pepsi Taste Test Challenge has students design and carry out an experiment to determine whether or not students are able to correctly identify two brands of cola in a blind taste test.In the first stage of the activity students design and conduct the experiment. In the second part of the activity students use Sampling SIM software (freely downloadable from http://www.tc.umn.edu/~delma001/stat_tools/) to simulate and gather information on what would be expected under chance conditions (i.e., if students obtained correct answers only by guessing). The students then compare the observed results to the chance results and make an inference about whether a given student can in fact correctly identify Coke and Pepsi in a blind taste test. Finally, the experiment is critiqued in terms of how well it met the standards for a good experiment.
This activity allows students to gain a better understanding of the experimental process and causality through considering control, random assignment, and possible confounding variables. The activity also allows students to begin to understand the process of hypothesis testing by comparing their observed results of the taste test to the results obtained through Sampling SIM (which model would be obtained by chance). Students make an inference about whether particular students in their class can truly tell the difference between Coke and Pepsi by reasoning about how surprising the observed results are compared to the simulated distribution of correct identifications by guessing. The activity also provides an opportunity for discussing generalizability to a population.
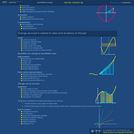
In the first part of this video introduction to combinatorics, we introduce …
In the first part of this video introduction to combinatorics, we introduce factorial notation to efficiently describe the ways we can arrange distinguishable objects in a row. Next, we count the combinations of L objects that can be grabbed from a container of L + N total objects. Finally, we use the formula for combinations to derive the binomial theorem.
The primary purpose of this problem is to rewrite simple rational expressions …
The primary purpose of this problem is to rewrite simple rational expressions in different forms to exhibit different aspects of the expression, in the context of a relevant real-world context (the fuel efficiency of of a car). Indeed, the given form of the combined fuel economy computation is useful for direct calculation, but if asked for an approximation, is not particularly helpful.
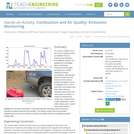
As a class, students use a low-cost air quality monitor (a rentable …
As a class, students use a low-cost air quality monitor (a rentable “Pod”) to measure the emissions from different vehicles. By applying the knowledge about combustion chemistry that they gain during the pre-activity reading (or lecture presentation, alternatively), students predict how the emissions from various vehicles will differ in terms of pollutants (CO2, VOCs and NO2), and explain why. After data collection, students examine the time series plots as a class—a chance to interpret the results and compare them to their predictions. Short online videos and a current event article help to highlight the real-world necessity of understanding and improving vehicle emissions. Numerous student handouts are provided. The activity content may be presented independently of its unit and without using an air quality monitor by analyzing provided sample data.
This comic book has been designed as an engaging and enjoyable experience …
This comic book has been designed as an engaging and enjoyable experience for students to understand the concept of 'Arithmetic Progression'. Its purpose is to present the concept of arithmetic progression in a way that resonates with students' lives. By following the adventures of relatable characters as they navigate real-life scenarios using parallelograms, readers will develop a deeper understanding of the mathematical concept. It involves practical problem-solving scenarios where characters learn and use parallel sequences to overcome challenges. It also encourages readers to think critically and analytically as they follow the characters on their learning journey.
The following Problem Based Learning (PrBL) curriculum maps are based on the …
The following Problem Based Learning (PrBL) curriculum maps are based on the Math Common Core State Standards and the associated scope and sequences. The problems and tasks have been scoured from thoughtful math bloggers who have advanced math educator practice by posting their materials online.
CODAP (Common Online Data Analysis Platform) is an easy to use data …
CODAP (Common Online Data Analysis Platform) is an easy to use data analysis environment that can be used in a wide variety of educational settings. CODAP is designed for grades 5 through 14, and aimed at teachers and curriculum developers. CODAP can be used across the curriculum to help students summarize, visualize, and interpret data, Conadvancing their skills to use data as evidence to support a claim.
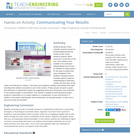
Students groups create scientific research posters to professionally present the results of …
Students groups create scientific research posters to professionally present the results of their AQ-IQ research projects, which serves as a conclusion to the unit. (This activity is also suitable to be conducted independently from its unit—for students to make posters for any type of project they have completed.) First, students critically examine example posters to gain an understanding of what they contain and how they can be made most effective for viewers. Then they are prompted to analyze and interpret their data, including what statistics and plots to use in their posters. Finally, groups are given a guide that aids them in making their posters by suggesting all the key components one would find in any research paper or presentation. This activity is suitable for presenting final project posters to classmates or to a wider audience in a symposium or expo environment. In addition to the poster-making guide, three worksheets, six example posters, a rubric and a post-unit survey are provided.
Students will calculate various measures of central tendency using data on the …
Students will calculate various measures of central tendency using data on the number of people who bike to work in select states. Students will then create a box plot to represent the data set and answer conceptual questions about the impact of the data set’s outlier.
This task gives students an opportunity to work with exponential functions in …
This task gives students an opportunity to work with exponential functions in a real world context involving continuously compounded interest. They will study how the base of the exponential function impacts its growth rate and use logarithms to solve exponential equations.
This lesson unit is intended to help teachers assess how well students …
This lesson unit is intended to help teachers assess how well students are able to interpret exponential and linear functions and in particular to identify and help students who have the following difficulties: translating between descriptive, algebraic and tabular data, and graphical representation of the functions; recognizing how, and why, a quantity changes per unit intervale; and to achieve these goals students work on simple and compound interest problems.
Using a survey from the CDC, students will compare the percents of …
Using a survey from the CDC, students will compare the percents of students involved in risk behaviors in their state and comparable states.They will discuss and defend their findings based on two different type graphs.
In this model eliciting activity (MEA), students are hired by a travel …
In this model eliciting activity (MEA), students are hired by a travel magazine to determine if two airlines that fly into Chicago are equally reliable. They examine data of flight arrival delay times for both airlines flying out of the same city. They first identify measures that can be used to compare the two airlines. Working in small groups, the students decide the size of a meaningful difference between the airlines for each measure and use that information to determine a rule that for deciding if one airline is more reliable than another. The students apply their rule to flight arrival delay data for the two airlines from four additional departure cities, and use the results to write a report to the magazine editor on whether or not one airline is more reliable than the other. This activity can serve as an introduction to ideas of central tendency and variability, and prepares students for formal approaches to comparing groups.
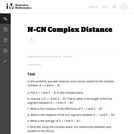
This problem is intended to reinforce the geometric interpretation of distance between …
This problem is intended to reinforce the geometric interpretation of distance between complex numbers and midpoints as modulus of the difference and average respectively.
No restrictions on your remixing, redistributing, or making derivative works. Give credit to the author, as required.
Your remixing, redistributing, or making derivatives works comes with some restrictions, including how it is shared.
Your redistributing comes with some restrictions. Do not remix or make derivative works.
Most restrictive license type. Prohibits most uses, sharing, and any changes.
Copyrighted materials, available under Fair Use and the TEACH Act for US-based educators, or other custom arrangements. Go to the resource provider to see their individual restrictions.