A learning activity for the Scoop on Soils book in the Elementary …
A learning activity for the Scoop on Soils book in the Elementary GLOBE Series. Each student will make predictions about the properties of various soil samples. Then they will examine several types of soils and record their observations. Next, they will learn about soil profiles and horizons by both examining a soil sample in a jar and by creating a soil profile flip chart. The purpose of the activity is to provide the opportunity for students to ask questions and make observations about soil and introduce students to the properties of soil and to the concept of soil profiles and horizons. After completing this activity, students will know about soil's different properties and about soil profiles. Students will know that soils have different properties including texture, color, and size. They will know that soil forms layers based on these properties.
A learning activity for the Scoop on Soils book in the Elementary …
A learning activity for the Scoop on Soils book in the Elementary GLOBE Series. Students will make predictions about what they think they will find in a sample of soil. They will investigate the sample and sort out the various items they find. Next they will spend time outside observing one or more sites to see what they find in the soil. After recording and sharing their observations they will create their own stories about the things they found in the soil. The purpose of the activity is to learn about natural things commonly found in soil and how these things impact how the soil looks and feels as well as to introduce students to the concept of decomposition. After completing this activity, students will know about various things found in soil including rocks, critters, roots, and other organic material. They will also understand that animals and microorganisms aid in the decomposition process that contributes organic materials to soils.
This is an advanced course on modeling, design, integration and best practices …
This is an advanced course on modeling, design, integration and best practices for use of machine elements such as bearings, springs, gears, cams and mechanisms. Modeling and analysis of these elements is based upon extensive application of physics, mathematics and core mechanical engineering principles (solid mechanics, fluid mechanics, manufacturing, estimation, computer simulation, etc.). These principles are reinforced via (1) hands-on laboratory experiences wherein students conduct experiments and disassemble machines and (2) a substantial design project wherein students model, design, fabricate and characterize a mechanical system that is relevant to a real world application. Students master the materials via problems sets that are directly related to, and coordinated with, the deliverables of their project. Student assessment is based upon mastery of the course materials and the student’s ability to synthesize, model and fabricate a mechanical device subject to engineering constraints (e.g. cost and time/schedule).
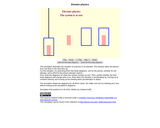
The simulation illustrates the situation of a person in an elevator. The …
The simulation illustrates the situation of a person in an elevator. The elevator takes the person from one floor to the next floor up. For this situation, try sketching three free-body diagrams, one for the person, another for the elevator, and a third for the person-elevator system. First, draw the diagrams for when the system remains at rest. Then, predict whether the free-body diagrams will change (and, if so, how) when the elevator is accelerating up, moving up at constant velocity, and moving up but slowing down (acceleration is down).
The simulation draws the diagrams for all these cases, but make sure you try drawing your own before looking at the simulation's diagrams.
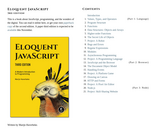
This book contains roughly three parts. The first 11 chapters discussthe JavaScript …
This book contains roughly three parts. The first 11 chapters discussthe JavaScript language itself. The next eight chapters are about webbrowsers and the way JavaScript is used to program them. Finally,two chapters are devoted to Node.js, another environment to programJavaScript in.Throughout the book, there are five project chapters, which describelarger example programs to give you a taste of real programming. Inorder of appearance, we will work through building an artificial life simulation,a programming language, a platform game, a paint program,and a dynamic website.
This resource is a video abstract of a research paper created by …
This resource is a video abstract of a research paper created by Research Square on behalf of its authors. It provides a synopsis that's easy to understand, and can be used to introduce the topics it covers to students, researchers, and the general public. The video's transcript is also provided in full, with a portion provided below for preview:
"Dietary fiber is an important part of a healthy diet, but how it interacts with our gut microbiome and the mechanisms underlying its benefits are poorly understood in humans. A recent exploratory trial examined how two structurally distinct purified fibers affected adults with excess weight. One of the dietary fibers, arabinoxylan (AX), was fermentable by the microbiome, while the second, microcrystalline cellulose (MCC), was not fermentable. An innovative technique called biorthogonal non-canonical amino acid tagging (BONCAT) was also used to identify specific microbes involved in AX fermentation. AX supplementation increased satiety after a meal compared to non-fermentable MCC. Using machine learning models, these effects on satiety could be predicted by BONCAT identified microbes that fermented AX. AX also attenuated insulin resistance relative to MCC, but the effects were not linked to the microbiome..."
The rest of the transcript, along with a link to the research itself, is available on the resource itself.
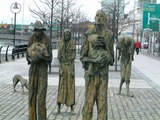
Students will examine the Irish Potato Famine through the lens of data. …
Students will examine the Irish Potato Famine through the lens of data. Creating, transforming and analyzing different data visualizations will give students an opportunity to utilize real world STEM skills in a traditional social studies class, without compromising the nature of understanding the historical narrative.
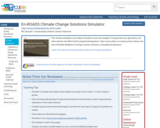
This climate simulation tool makes it intuitive to see how changes in …
This climate simulation tool makes it intuitive to see how changes in energy, land use, agriculture, and other policies will affect Earth's projected temperature. Users move sliders on various policy actions and see immediate feedback on energy sources, emissions, and global temperature.
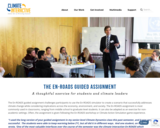
The En-ROADS guided assignment challenges participants to use the free online En-ROADS …
The En-ROADS guided assignment challenges participants to use the free online En-ROADS simulator (https://en-roads.climateinteractive.org/) to create a scenario that successfully addresses climate change while considering implications across the economy, environment, and society. The En-ROADS assignment is used in classrooms, ranging from middle school to graduate level students, and comes in short and long forms. It can also be adapted as an exercise for non-academic settings. Often, the assignment is given following an En-ROADS workshop or Climate Action Simulation role-playing simulation game (https://www.climateinteractive.org/en-roads/).
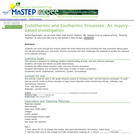
This inquiry-based lab will allow students to investigate endothermic and exothermic processes …
This inquiry-based lab will allow students to investigate endothermic and exothermic processes with everyday materials and predict the outcome of experiment based on their findings.
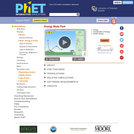
This pair of interactive visualizations allows students to explore basic and more …
This pair of interactive visualizations allows students to explore basic and more complex concepts around heat conduction, heat capacity and energy transfer. The basic simulation demonstrates how heating and cooling iron, brick, water, and olive oil adds or removes energy from a system and transfers between objects. At the more advanced level, the systems simulation allows students to see that energy takes various forms, as well as how energy flows and changes from one form of energy into another.
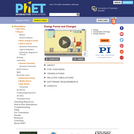
This simulation lets learners explore how heating and cooling adds or removes …
This simulation lets learners explore how heating and cooling adds or removes energy. Use a slider to heat blocks of iron or brick to see the energy flow. Next, build your own system to convert mechanical, light, or chemical energy into electrical or thermal energy. (Learners can choose sunlight, steam, flowing water, or mechanical energy to power their systems.) The simulation allows students to visualize energy transformation and describe how energy flows in various systems. Through examples from everyday life, it also bolsters understanding of conservation of energy. This item is part of a larger collection of simulations developed by the Physics Education Technology project (PhET).
This activity challenges students to try and meet the world's projected energy …
This activity challenges students to try and meet the world's projected energy demand over the next century, decade by decade, by manipulating a menu of available energy sources in the online Energy lab simulator all while keeping atmospheric CO2 under a target 550ppm.
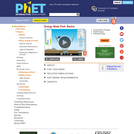
This data visualization describes global and regional energy production. A pie chart …
This data visualization describes global and regional energy production. A pie chart shows percentage of each energy source used in various different countries.
Learn about conservation of energy with a skater dude! Build tracks, ramps …
Learn about conservation of energy with a skater dude! Build tracks, ramps and jumps for the skater and view the kinetic energy, potential energy and friction as he moves. You can also take the skater to different planets or even space!
Students experiment with an online virtual laboratory set at a skate park. …
Students experiment with an online virtual laboratory set at a skate park. They make predictions of graphs before they use the simulation to create graphs of energy vs. time under different conditions. This simulation experimentation strengths their comprehension of conservation of energy solely between gravitational potential energy and kinetic energy
Learn about conservation of energy with a skater dude! Build tracks, ramps …
Learn about conservation of energy with a skater dude! Build tracks, ramps and jumps for the skater and view the kinetic energy, potential energy and friction as he moves. You can also take the skater to different planets or even space!
Students will: Predict the kinetic and potential energy of objects Design a …
Students will: Predict the kinetic and potential energy of objects Design a skate park Examine how kinetic and potential energy interact with each other
This lesson covers concepts of energy and energy transfer utilizing energy transfer …
This lesson covers concepts of energy and energy transfer utilizing energy transfer in musical instruments as an example. More specifically, the lesson explains the two different ways in which energy can be transferred between a system and its environment. The law of conservation of energy will also be taught. Example systems will be presented to students (two cars on a track and a tennis ball falling to the ground) and students will be asked to make predictions and explain the energy transfer mechanisms. The engineering focus comes in clearly in the associated activity when students are asked to apply the fundamental concepts of the lesson to design a musical instrument. The systems analyzed in the lesson should help a great deal in terms of discussing how to apply conservation of energy and energy transfer to make things.
This simple data visualization allows students to compare primary energy use and …
This simple data visualization allows students to compare primary energy use and several other variables (carbon dioxide emissions, oil consumption) among different countries, including by OECD and non-OECD status. Students have the ability to toggle a handful of different ways to visualize the data, such as on a map, a bar chart, or a line graph.
No restrictions on your remixing, redistributing, or making derivative works. Give credit to the author, as required.
Your remixing, redistributing, or making derivatives works comes with some restrictions, including how it is shared.
Your redistributing comes with some restrictions. Do not remix or make derivative works.
Most restrictive license type. Prohibits most uses, sharing, and any changes.
Copyrighted materials, available under Fair Use and the TEACH Act for US-based educators, or other custom arrangements. Go to the resource provider to see their individual restrictions.