This resource introduces the concept of wind chill, the formula used to …
This resource introduces the concept of wind chill, the formula used to measure it and relates it to the causes of hypothermia. A simple experiment using a pie pan, sand, fan and a thermometer demonstrates this concept. The resource is from PUMAS - Practical Uses of Math and Science - a collection of brief examples created by scientists and engineers showing how math and science topics taught in K-12 classes have real world applications.
Students learn of the impending asteroid impact scenario, form teams and begin …
Students learn of the impending asteroid impact scenario, form teams and begin to study the situation in depth. A simple in-class simulation shows them the potential for destruction and disaster. They complete worksheets and look at maps to help them define and understand the problem: What is the needed cavern size and depth? What are the geographical areas and natural features? A homework measurement assignment prepares them for the next lesson/activity.
The full Breakout EDU is available on the Breakout EDU platform. In …
The full Breakout EDU is available on the Breakout EDU platform. In order to view/use this resource, you will have to have an account on the Breakout EDU platform. Students work through different STEM-based challenges. Students create a 3D shape cage. Students measure frogs, and students code a path. At beginning of the Breakout EDU the teacher reads aloud a book about Golden Frog.
How to participate in the process of evidence-based practice Short Description: This …
How to participate in the process of evidence-based practice
Short Description: This primer supports social workers in learning the basics of evaluation as it relates to engaging in evidence-based practice at the micro, mezzo and macro levels. It is designed for students who have already had an introductory research methods course who are now engaged in an evaluation project or course.
Long Description: This primer supports social workers in learning the basics of evaluation as it relates to engaging in evidence-based practice at the micro, mezzo and macro levels. It is designed for students who have already had an introductory research methods course who are now engaged in an evaluation project or course. This primer is designed to support students in understanding the basics of practice evaluation techniques in a language that makes sense to them. Practice evaluation has two parts, the analysis of the efficacy of practice with clients (or client systems, such as groups, or communities) and the critical interpretation of practice evaluation results. Therefore, the book follows this format. The analysis of practice efficacy involves the careful design of evaluation studies and collection of evaluation data. This is followed by the careful analysis of client data (quantitative and/or qualitative). The critical consumption of evaluation results requires ‘fluency’ in interpreting basic statistical data as well as rigorous qualitative data analyses. In order to be ethical practitioners, social work practitioners need to be both practice evaluators and critical consumers of evaluation data. This simple primer presents this process in simple language designed to engage social work practitioners from an evidence-based practice perspective.
Word Count: 30571
(Note: This resource's metadata has been created automatically by reformatting and/or combining the information that the author initially provided as part of a bulk import process.)
Second Edition Short Description: This textbook is based on materials sourced from …
Second Edition
Short Description: This textbook is based on materials sourced from different practitioners from the world of research design, data collection, analysis, and interpretation. The author and her collaborators have also added materials to supplement the available literature.
Long Description: Increasingly, the concept of marketing research is being replaced with the term ‘customer or consumer insights’. As decision-makers are bombarded with data, it is important to have an Insights Team or Department which can sift through it all and identify those nuggets of information that can meaningfully explain human behaviour. Such insights must translate into an informed business strategy for success. This book has been curated to ensure that the practice of data collection, analysis, and interpretation is presented from an industry perspective.
Word Count: 42069
(Note: This resource's metadata has been created automatically by reformatting and/or combining the information that the author initially provided as part of a bulk import process.)
This unit was developed for a junior level pre-Calculus class to be …
This unit was developed for a junior level pre-Calculus class to be taught during the first quarter of the 2016-17 school year. The lessons of the unit will culminate in each group of students creating and analyzing a mathematical model to predict the future impacts of climate change in New Hampshire and make a presentation as a group. The texts and historic data source, while specific to New Hampshire, may be of interest to other regions of the country. However, state climate change reports and climate data specific to your location may be available through state universities and meteorological stations.
Included in the course are introductions to each lesson, lecture slides, videos, and problem questions. Topics include:
Types of Data Sampling Techniques Qualitative Data Frequency Distributions Descriptive Statistics Variation and Position Confidence Intervals Hypothesis Testing Chi-Square Goodness of Fit Linear Regression Variance ANOVA
The relationships we cultivate in our lives are essential to our well-being—namely, …
The relationships we cultivate in our lives are essential to our well-being—namely, happiness and health. Why is that so? We begin to answer this question by exploring the types of relationships—family, friends, colleagues, and lovers—we have in our lives and how they are measured. We also explore the different aspects of happiness and health, and show how the quantity and quality of relationships can affect our happiness and health.
This lesson is a series of videos that cover Cold War fears …
This lesson is a series of videos that cover Cold War fears of the 1940s and 50s. It describers how the American Public were given measures to protect themselves against and invasion or an atomic attack. The lesson also has the student to view several videos on the domestic policies of the United states and a general overview of Cold war policies. Students will have to interpret point of view and argumentation from both sides of the political spectrum.
The author examines affective domain assessment, which focuses on evaluating individuals' attitudes, …
The author examines affective domain assessment, which focuses on evaluating individuals' attitudes, values, beliefs, and emotions related to a particular subject or domain. This type of assessment aims to measure the affective aspects of learning, such as motivation, engagement, and empathy. The author may discuss methods for assessing the affective domain, such as surveys, interviews, or self-assessments, and highlight the importance of considering learners' emotions and attitudes in the educational process.AFFECTIVE-ASSESSMENT.docx
The measurable goal and curricular aim of this lesson are for students …
The measurable goal and curricular aim of this lesson are for students to be able to fluently retrieve words in spelling patterns, and correctly spell both irregularly-spelled grade-appropriate words and words with vowel and consonant-blend patterns. The three activities in this lesson plan enables students to use the knowledge they have learned in class to complete. Students have an individual assesment at the end to write their own story incorporating the concepts from this lesson.
The primary activity described here is measurement of sub-surface water properties in …
The primary activity described here is measurement of sub-surface water properties in a local pond (e.g., temperature and dissolved oxygen). This activity combines concepts and skills from Geology, Biology and Chemistry.
(Note: this resource was added to OER Commons as part of a batch upload of over 2,200 records. If you notice an issue with the quality of the metadata, please let us know by using the 'report' button and we will flag it for consideration.)
This guide walks you through the Checkology virtual classroom for grades 6-12 …
This guide walks you through the Checkology virtual classroom for grades 6-12 from the News Literacy Project. Students can move at their own pace through a wide variety of lessons that mostly focus on journalism and news literacy, but also cover misinformation, conspiracy theories, and other relevant topics.The lessons include videos of journalists and other experts, plus visually engaging interactive activities.
Utilizing online and traditional resources students will collect data on planets and …
Utilizing online and traditional resources students will collect data on planets and moons in our solar system. Working collaboratively students will generate a spreadsheet of the data. After verifying one another's information, they will then use the spreadsheet to try and determine ways in which the Earth is unique amongst the objects in our solar system, including, but not limited to, the reasons behind Earth's ability to support life.
(Note: this resource was added to OER Commons as part of a batch upload of over 2,200 records. If you notice an issue with the quality of the metadata, please let us know by using the 'report' button and we will flag it for consideration.)
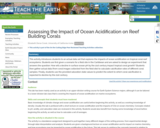
This activity introduces students to an actual data set that explores the …
This activity introduces students to an actual data set that explores the impacts of ocean acidification on tropical coral reef ecosystems. Students are first given a scenario for a field site in the Caribbean and are asked to design an experiment that answers the question: How will a decline in surface ocean pH by the 21st century impact tropical coral growth? Students then gather actual data (from coral images collected from the field site) to calculate calcification rates of different coral samples. Finally, students use the provided saturation state values to predict the extent to which coral calcification is expected to decline by the 21st century.
In this activity, students will learn about population movement, migration trends, and …
In this activity, students will learn about population movement, migration trends, and the westward expansion of the early 1800s. First, students will create a line graph that depicts changes in aggregated population data from 1800 to 1850 for Illinois, Indiana, Missouri, and Ohio. Using this graph, students will make data comparisons and draw conclusions. Next, students will compare the populations of several states between 1790 and 1850 and make conclusions that demonstrate their understanding of population trends in northern and southern states. This activity can spark discussion of sectionalism, slavery, and the different economic climate that took shape in the northern and southern states in the early 1800s.
This short video discusses where carbon dioxide, the gas that is mainly …
This short video discusses where carbon dioxide, the gas that is mainly responsible for warming up our planet and changing the climate, comes from. It discusses how the rise in atmospheric carbon dioxide comes directly from the burning of fossil fuels and indirectly from the human need for energy.
A key first step toward developing students' understanding Woburn's water problems is …
A key first step toward developing students' understanding Woburn's water problems is having a students understand the geologic model of the Aberjona River Valley. Geologist use a series of tools to be able to construct models of the subsurface features of a given location. The first step in this tool is to look at these are official features of an area to gain a perspective of the subsurface composition. Geologist typically then will drill borings into the subsurface to obtain samples of rocks. During the drilling process geologist will measure the depth at which changes in rock type occur, they also will try to identify similar rock types and different borings to come up with a spatial arrangement of rock layers. This data is then used to construct the geologic cross-section. So the objective of this module is to get students familiar with its surface and subsurface geologic features so that they may begin to interpret the interrelation between geology and hydrogeology. Geologic logs are provided for students to create their own subsurface geologic cross-sections, which can be applied to later modules when they begin to evaluate groundwater flow towards Wells G & H.
(Note: this resource was added to OER Commons as part of a batch upload of over 2,200 records. If you notice an issue with the quality of the metadata, please let us know by using the 'report' button and we will flag it for consideration.)
Students will examine ways declining bee population can impact day to day …
Students will examine ways declining bee population can impact day to day life, by considering how the cost of honey and pollination has been affected society Students will create real-world problems that relate to statistics on the declining bee population.
No restrictions on your remixing, redistributing, or making derivative works. Give credit to the author, as required.
Your remixing, redistributing, or making derivatives works comes with some restrictions, including how it is shared.
Your redistributing comes with some restrictions. Do not remix or make derivative works.
Most restrictive license type. Prohibits most uses, sharing, and any changes.
Copyrighted materials, available under Fair Use and the TEACH Act for US-based educators, or other custom arrangements. Go to the resource provider to see their individual restrictions.