Updating search results...

Search Resources

1978 Results

View
Selected filters:
Field observations of mass transport
Conditional Remix & Share Permitted
CC BY-NC-SA
Rating
0.0 stars

In this activity students use published data from the Massachusetts Military Reservation to observe and predict mass transport parameters.

(Note: this resource was added to OER Commons as part of a batch upload of over 2,200 records. If you notice an issue with the quality of the metadata, please let us know by using the 'report' button and we will flag it for consideration.)
Subject:
Biology
Hydrology
Life Science
Physical Science
Material Type:
Activity/Lab
Provider:
Science Education Resource Center (SERC) at Carleton College
Provider Set:
Teach the Earth
Author:
Jodi Ryder
Date Added:
11/30/2020
The Fight for Resources
Conditional Remix & Share Permitted
CC BY-NC-SA
Rating
0.0 stars

Objective:  This hands on activity is designed for middle school students to simulate the competition that occurs between organisms within the same ecosystem. Students will play the role of an organism where they will compete for resources (beads).   Students will collect and analyze data as well as answer conclusion questions.   South Carolina State Science Standards: SC: 7-LS2-1, 7-LS2-2, 7-LS2-4  (Preview Image): "Predator&Prey" by Rathika Ramasamy is licensed under CC BY 2.0  retrieved from https://www.flickr.com/photos/28163014@N00/690266517  

Subject:
Biology
Ecology
Elementary Education
Material Type:
Activity/Lab
Author:
Kimberly Hageman
Date Added:
03/24/2023
Final - Learning About Aurorae - The Planeterrella Experiment
Conditional Remix & Share Permitted
CC BY-NC
Rating
0.0 stars

This unit emphasizes literacy skills for STEAM students, using the Planeterrella Experiment to learn about aurorae. Guided by text-dependent questions, students will study and gather evidence from anchor and supplemental texts on the Planeterrella’s design, purpose and history, magnetic currents and their role in aurorae, the Van Allen Belt, the Lorenz Effect, and how global warming impacts aurorae. Students will perform experiments with magnetic currents and create a lab simulation of the aurora borealis using textual evidence and data from the anchor and supplemental texts.

Subject:
Career and Technical Education
Education
Physical Science
Material Type:
Unit of Study
Date Added:
10/27/2016
Financial Markets (2008)
Conditional Remix & Share Permitted
CC BY-NC-SA
Rating
0.0 stars

Financial institutions are a pillar of civilized society, supporting people in their productive ventures and managing the economic risks they take on. The workings of these institutions are important to comprehend if we are to predict their actions today and their evolution in the coming information age. The course strives to offer understanding of the theory of finance and its relation to the history, strengths and imperfections of such institutions as banking, insurance, securities, futures, and other derivatives markets, and the future of these institutions over the next century.

Subject:
Business and Communication
Economics
Finance
Social Science
Material Type:
Assessment
Full Course
Lecture
Lecture Notes
Syllabus
Provider:
Yale University
Provider Set:
Open Yale Courses
Author:
Robert Shiller
Date Added:
02/16/2011
Finding and predicting hurricane activity through GIS
Conditional Remix & Share Permitted
CC BY-NC-SA
Rating
0.0 stars

Students must be able to search for, find, download, display, query and map hurricane and other relevant GIS data.
Hurricane data spans 1851-2008 and is from: http://www.fgdl.org/metadataexplorer/explorer.jsp
Countries data is from: http://www.diva-gis.org
Learning outcomes: For students be able to successfully use GIS data to answer a basic spatial research question. Many skills are required for this seemingly simple question: creating a correct query that matches the data, understanding hurricane and weather patterns for example.

Subject:
Atmospheric Science
Physical Science
Material Type:
Activity/Lab
Homework/Assignment
Provider:
Science Education Resource Center (SERC) at Carleton College
Provider Set:
Teach the Earth
Author:
Jennifer Gebelein
Date Added:
01/20/2023
Finite Element Analysis of Solids and Fluids I
Conditional Remix & Share Permitted
CC BY-NC-SA
Rating
0.0 stars

This course introduces finite element methods for the analysis of solid, structural, fluid, field, and heat transfer problems. Steady-state, transient, and dynamic conditions are considered. Finite element methods and solution procedures for linear and nonlinear analyses are presented using largely physical arguments. The homework and a term project (for graduate students) involve use of the general purpose finite element analysis program ADINA. Applications include finite element analyses, modeling of problems, and interpretation of numerical results.

Subject:
Applied Science
Engineering
Mathematics
Material Type:
Full Course
Provider:
MIT
Provider Set:
MIT OpenCourseWare
Author:
Bathe, Klaus-Jürgen
Date Added:
09/01/2009
Finite Element Procedures for Solids and Structures
Conditional Remix & Share Permitted
CC BY-NC-SA
Rating
0.0 stars

Finite element analysis is now widely used for solving complex static and dynamic problems encountered in engineering and the sciences. In these two video courses, Professor K. J. Bathe, a researcher of world renown in the field of finite element analysis, teaches the basic principles used for effective finite element analysis, describes the general assumptions, and discusses the implementation of finite element procedures for linear and nonlinear analyses.
These videos were produced in 1982 and 1986 by the MIT Center for Advanced Engineering Study.

Subject:
Applied Science
Engineering
Mathematics
Material Type:
Full Course
Provider:
MIT
Provider Set:
MIT OpenCourseWare
Author:
Bathe, Klaus-Jürgen
Date Added:
02/01/2010
Finite Order Statistic Experiment
Unrestricted Use
CC BY
Rating
0.0 stars

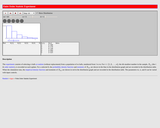
This resource consists of a Java applet and expository text. The applet is a simulation of the experiment of selecting n objects at random from the first m positive integers. The random variables of interest are the order statistics. The applet illustrates the distributions of the order statistics.

Subject:
Mathematics
Statistics and Probability
Material Type:
Activity/Lab
Interactive
Simulation
Provider:
University of Alabama in Huntsville
Provider Set:
Virtual Laboratories in Probability and Statistics
Author:
Kyle Siegrist
Date Added:
02/16/2011
First Grade Elementary Science and Integrates Subjects-Sky Explorers
Unrestricted Use
CC BY
Rating
0.0 stars

The First Grade Elementary Framework for Science and Integrated Subjects, Sky Explorers uses observation of the sun and moon in the sky as a phenomena for exploring patterns of objects in the sky.  It is part of Elementary Framework for Science and Integrated Subjects project, a statewide Clime Time collaboration among ESD 123, ESD 105, North Central ESD, and the Office of Superintendent of Public Instruction. Development of the resources is in response to a need for research- based science lessons for elementary teachers that are integrated with English language arts, mathematics and other subjects such as social studies. The template for Elementary Science and Integrated Subjects  can serve as an organized, coherent and research-based roadmap for teachers in the development of their own NGSS aligned science lessons.  Lessons can also be useful for classrooms that have no adopted curriculum as well as to serve as enhancements for  current science curriculum. The EFSIS project brings together grade level teams of teachers to develop lessons or suites of lessons that are 1) pnenomena based, focused on grade level Performance Expectations, and 2) leverage ELA and Mathematics Washington State Learning Standards.

Subject:
Astronomy
Education
Elementary Education
English Language Arts
Measurement and Data
Material Type:
Activity/Lab
Module
Reading
Author:
Georgia Boatman
Date Added:
05/20/2021
Fitting A Line to Data
Read the Fine Print
Rating
0.0 stars

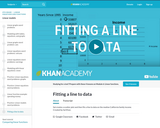
Khan Academy tutorial video that uses Excel spreadsheet and actual income data to predict annual income and expresses why lines and models are useful and interesting.

Subject:
Algebra
Education
Mathematics
Material Type:
Teaching/Learning Strategy
Provider:
Florida Center for Research in Science, Technology, Engineering, and Mathematics
Provider Set:
iCPALMS: A Standards-based K-12 Resources and Tools Pathway
Author:
Salman Khan
Date Added:
03/17/2011
Floating Metal Pins - Discrepant Event/Guided Inquiry on Surface Tension
Conditional Remix & Share Permitted
CC BY-NC-SA
Rating
0.0 stars

This activity is a guided inquiry on surface tension where students design their own lab experiment based on a focus question, make predictions, collect data and compare the outcome with their predictions.

Subject:
Mathematics
Physical Science
Physics
Material Type:
Activity/Lab
Assessment
Lesson Plan
Provider:
Science Education Resource Center (SERC) at Carleton College
Provider Set:
Pedagogy in Action
Date Added:
12/09/2011
Flooding in Virginia
Read the Fine Print
Rating
0.0 stars

In this activity, students use a National Weather Service flood forecast, USGS gauging data, and other reports to estimate the maximum storm discharge from the New River and Wolf Creek, two streams in the Southeast U.S. which experienced flooding in November 2003. Topographic and urban maps are used to predict where flooding would occur and to evaluate strategies for reducing flood risk for the residents of the region.

Subject:
Astronomy
Chemistry
Geoscience
Hydrology
Physical Science
Physics
Space Science
Material Type:
Activity/Lab
Interactive
Provider:
UCAR Staff
Provider Set:
New York State Earth Science Instructional Collection
Author:
Drew Patrick
Date Added:
11/06/2014
Flooding in the Finger Lakes Region, NY
Conditional Remix & Share Permitted
CC BY-NC-SA
Rating
0.0 stars

In this several week-long introductory geoscience project, students evaluate the potential for flooding in the local region. Students visit the site during the first week of the semester as part of a "Walk in the Watershed" and make observations in order to generate hypotheses about the processes that shape the landscape and control the movement of water. During a later lab period, students return to the same site to determine stream discharge using the flotation and current meter methods and compare and contrast the results from the two methods. In addition, students in the different laboratory sections use their data to compare and contrast reasons for why discharge may have changed over the course of the day or week during the following class meeting. As an in-class exercise, students examine an annual hydrograph and then predict the weather that generated the observed stream discharge. Students test their hypotheses by analyzing precipitation data available on-line in order to correlate flood events with storm types or other causes for major discharge events. Next, students examine historical flood and discharge data of the local stream available on-line at http://nwis.waterdata.usgs.gov/ as a homework assignment. In addition to calculating the recurrence interval and probability of occurrence for each event, students determine the discharge and stage of a 1-, 10-, 50-, and 100-year flood, create a rating curve, and generate a floodway map for each of these events. Subsequently, students revisit the site during lab and locate the boundaries of these flood events. Students will make recommendations for building a house in the region based on their analyses.

(Note: this resource was added to OER Commons as part of a batch upload of over 2,200 records. If you notice an issue with the quality of the metadata, please let us know by using the 'report' button and we will flag it for consideration.)
Subject:
Biology
Geoscience
Life Science
Mathematics
Measurement and Data
Physical Science
Statistics and Probability
Material Type:
Activity/Lab
Provider:
Science Education Resource Center (SERC) at Carleton College
Provider Set:
Teach the Earth
Author:
Tara Curtin
Date Added:
08/20/2019
Floodplain Modeling
Read the Fine Print
Educational Use
Rating
0.0 stars

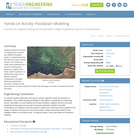
Students explore the impact of changing river volumes and different floodplain terrain in experimental trials with table top-sized riverbed models. The models are made using modeling clay in aluminum baking pans placed on a slight incline. Water added "upstream" at different flow rates and to different riverbed configurations simulates different potential flood conditions. Students study flood dynamics as they modify the riverbed with blockages or levees to simulate real-world scenarios.

Subject:
Applied Science
Engineering
Hydrology
Physical Science
Material Type:
Activity/Lab
Provider:
TeachEngineering
Provider Set:
TeachEngineering
Author:
Denise W. Carlson
Kristi Ekern
Malinda Schaefer Zarske
Tim Nicklas
Date Added:
10/14/2015
Flu Math Games
Conditional Remix & Share Permitted
CC BY-NC-SA
Rating
0.0 stars

This video lesson shows students that math can play a role in understanding how an infectious disease spreads and how it can be controlled. During this lesson, students will see and use both deterministic and probabilistic models and will learn by doing through role-playing exercises. The primary exercises between video segments of this lesson are class-intensive simulation games in which members of the class 'infect' each other under alternative math modeling assumptions about disease progression. Also there is an occasional class discussion and local discussion with nearby classmates.

Subject:
Biology
Life Science
Social Science
Sociology
Material Type:
Lecture
Provider:
MIT
Provider Set:
MIT Blossoms
Author:
Mai Perches
Richard C. Larson
Sahar Hashmi
Date Added:
07/12/2014
Flubber Flow
Read the Fine Print
Educational Use
Rating
0.0 stars

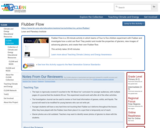
Flubber Flow is a 30-minute activity in which teams of four to five children experiment with Flubber and investigate how a solid can flow! They predict and model the properties of glaciers, view images of advancing glaciers, and create their own Flubber flow.

Subject:
Applied Science
Career and Technical Education
Environmental Science
Environmental Studies
Physical Science
Material Type:
Activity/Lab
Provider:
CLEAN: Climate Literacy and Energy Awareness Network
Provider Set:
CLEAN: Climate Literacy and Energy Awareness Network
Author:
Lunar and Planetary Institute
Date Added:
07/12/2021
Follow the Water
Read the Fine Print
Educational Use
Rating
0.0 stars

This six-week curriculum unit is designed for students in the second grade as they follow a water molecule through a watershed. The unit begins with Follow the Water from Brook to Ocean , a picture book by Arthur Dorros that introduces to primary-level students how water moves and how it has shaped our earth over time. The young scientists will use their skills of inquiry to understand the structure of a watershed, investigate human impact, and participate in activities and experiments throughout. Students will use journals to document their learning as they build vocabulary, identify stream order, discover how materials dissolve or not in our waters, create an aquifer, and design a game that simulates the pollution entering our watershed.

Subject:
English Language Arts
Life Science
Physical Science
Social Science
Material Type:
Lesson Plan
Unit of Study
Provider:
Yale-New Haven Teachers Institute
Provider Set:
2017 Curriculum Units Volume II
Date Added:
08/01/2017
Food Chains: Nature's Restaurant
Conditional Remix & Share Permitted
CC BY-NC-SA
Rating
0.0 stars

In these life science activities, students will participate in field observations of living things & do research of animals they observe to create a food chain & present it to the class. Students will participate in a food web simulation game.

Subject:
Biology
Life Science
Material Type:
Activity/Lab
Provider:
Science Education Resource Center (SERC) at Carleton College
Provider Set:
Pedagogy in Action
Author:
Jane Schaffran
Date Added:
08/16/2012
Foothill College AstroSims
Unrestricted Use
CC BY
Rating
0.0 stars

The Foothill College AstroSims project is ensuring continued access to astro-education simulations past the deprecation of Java and Flash. This site includes:

* re-implementations in HTML5/Javascript of existing astro-education simulations,
* new simulations of previously unaddressed topics, and
* a frequently updated list of astro-education simulations.

Subject:
Astronomy
Physical Science
Material Type:
Activity/Lab
Interactive
Simulation
Author:
Andrew Tran
Baba Kofi Weusijana
Chris Achenbach
Geoffrey Mathews
Safi Mohammed
Date Added:
07/07/2020
Forecasting Lake Effect Snow in Lake Superior region
Conditional Remix & Share Permitted
CC BY-NC-SA
Rating
0.0 stars

This exercise is designed to present the realistic problems of forecasting weather. Lake effect snows are hard to forecast because they depend on information that isn't part of the regular set of information and involve some pretty specific things that integrate the location of the site with surrounding environment. Even places close by can get totally different forecasts. When you have a regional forecast, it doesn't really address lake effect snows, unless the forecaster really focuses. So the exercise aims to show the value of broad critical thinking in meteorology, and it is very dramatic, because the difference between 36 inches and whiteout and clear blue sky is undeniable. The exercise comes when students are 8 weeks into the class. The class is an AMS based class, which has already been described well in this workshop by Julie Snow from Slippery Rock. Our class is given in the fall semester and lake effect snow starts in October and is quite an issue in forecasts until April. The skills of a forecaster are tested, and you cannot use forecasts from nearby areas reliably. Finally, we live in a fantastic snow belt, so lake effect snow happens a lot. In a good year we get over 300 inches of snow, mostly at times that places nearby do not. You can drive to Houghton in the bright sun and be met by a wall of very active blizzard just a few miles out of town.

There are some excellent tutorials available from COMET, and outreach of the National Weather Service. I use one done by Greg Byrd, which is available online or in a power point format. There are a number of things that must be learned before forecasting. These include some fluid dynamics of plumes, latent heat, remote sensing, upper air mapping, and the use of models. We cannot cover all them completely. I try to introduce all these things and give people entry points into the juicy parts of these topics, but do not expect students to understand completely. One thing you can spend a long time on are the satellite images. Here is one, just to whet your interest: http://serc.carleton.edu/details/images/13586.html


I have the students make a list of the critical parameters they think might be needed for a successful lake effect forecast. This is a challenge to prepare, but the idea is to include things that are even marginally useful and to collect data to see what is most important. We get a list of parameters like this:


850 mb wind direction
850 mb temperature
Lake Superior surface temperature
fetch length
opposing bay?
Inversion layer height
topographic lift factor
wind shear evidence
upstream lake
upstream moisture factor
snow/ice cover issues


This list is pretty good, but deliberately not complete, and we encourage students to add other things they think might be important. The next step is to find where you can get this information. I have web data sources for most (see below), and some of them are interrelated. You can do this exercise for any site around Lake Superior or probably many other lakes as well. For specific sites, the fetch length, upstream lake and opposing bay information are obtainable directly from the wind direction if you have a good map (Google Earth). So a spreadsheet for parameters related to wind direction can be prepared in advance and these parameters can be immediately available from the wind direction. Nonetheless the issue of sources for all this stuff must be addressed in an effort that spans several hours. The use of models is needed to look into the future where possible.

Once students know what they are looking for and how to find it, the exercise starts its data collection. Every day or every 6 or 12 hours beginning when conditions get close to "LES favorable" students collect information on these LES predictors. They also make LES forecasts for each period and include that information in the spreadsheet. The next day the real snowfall data is added to the spreadsheet, and this can be used as validation data for the forecast. This data collection needs to be done for several weeks (November and December in my case, usually a good time for LES).

The data analysis is the most challenging part. Spreadsheet plots which test the sensitivity of various parameters singly and together are possible. There is a lot of sophistication possible if there is enough LES to analyze. Overall, results should be a good experience with imperfect data addressed to a real-time problem. Models and real data, remote sensing, and balloons are all integrated and there are quite obvious weaknesses.

On the final day of class student groups will compete by doing forecasting which employs the LES techniques. This might reflect the most recent snow event. A more important element of this submission will be their evaluation of LES prediction parameters. Not only do we consider the actual forecast, but we discuss which parameters were successful? Which are inconclusive? What suggestions for improved forecasts are possible from the experience? The format of this will be short presentations with time for discussion.

(Note: this resource was added to OER Commons as part of a batch upload of over 2,200 records. If you notice an issue with the quality of the metadata, please let us know by using the 'report' button and we will flag it for consideration.)

Subject:
Applied Science
Atmospheric Science
Biology
Environmental Science
Life Science
Mathematics
Measurement and Data
Physical Science
Material Type:
Activity/Lab
Provider:
Science Education Resource Center (SERC) at Carleton College
Provider Set:
Teach the Earth
Author:
Bill Rose
Date Added:
08/24/2019