Updating search results...

Search Resources

285 Results

View
Selected filters:
Buttons: Statistical Questions
Unrestricted Use
CC BY
Rating
0.0 stars

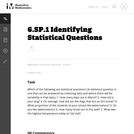
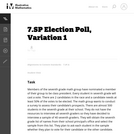
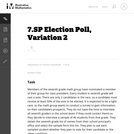
Statistics is the study of variability. Students who understand statistics need to be able to identify and pose questions that can be answered by data that vary. The purpose of this task is to provide questions related to a particular context (a jar of buttons) so that students can identify which are statistical questions. The task also provides students with an opportunity to write a statistical question that pertains to the context.

Subject:
Mathematics
Statistics and Probability
Material Type:
Activity/Lab
Provider:
Illustrative Mathematics
Provider Set:
Illustrative Mathematics
Author:
Illustrative Mathematics
Date Added:
10/19/2012
Probability and Statistics EBook
Read the Fine Print
Rating
5.0 stars

This is an Internet-based probability and statistics E-Book. The materials, tools and demonstrations presented in this E-Book would be very useful for advanced-placement (AP) statistics educational curriculum. The E-Book is initially developed by the UCLA Statistics Online Computational Resource (SOCR). However, all statistics instructors, researchers and educators are encouraged to contribute to this project and improve the content of these learning materials.
There are 4 novel features of this specific Statistics EBook. It is community-built, completely open-access (in terms of use and contributions), blends information technology, scientific techniques and modern pedagogical concepts, and is multilingual.

Subject:
Statistics and Probability
Material Type:
Textbook
Provider:
UCLA
Provider Set:
Statistics Online Computational Resource
Author:
Statistics Online Computational Resource
Date Added:
01/01/2007
6.SP Statistical Questions
Unrestricted Use
CC BY
Rating
0.0 stars

This is a task from the Illustrative Mathematics website that is one part of a complete illustration of the standard to which it is aligned. Each task has at least one solution and some commentary that addresses important aspects of the task and its potential use.

Subject:
Statistics and Probability
Material Type:
Activity/Lab
Provider:
Illustrative Mathematics
Provider Set:
Illustrative Mathematics
Author:
Illustrative Mathematics
Date Added:
08/06/2015
Statistics and the internet: Is the internet trustworthy?
Conditional Remix & Share Permitted
CC BY-NC
Rating
0.0 stars

Students will explore the overarching question, is the internet trustworthy?, while expanding their knowledge of statistics and comparing data sets.  They will compare two data sets as well as determine the accuracy or bias of data representations shown on the internet. Students will then have the opportunity to apply their knowledge while creating their own visual representations for data they personally collected regarding the trustworthiness of the internet.  The module concludes with a peer showcase and the post-assessment.

Subject:
Measurement and Data
Statistics and Probability
Material Type:
Lesson Plan
Author:
Blended Learning Teacher Practice Network
Date Added:
05/30/2018
Math, Grade 6, Distributions and Variability, Reviewing Statistical Questions
Conditional Remix & Share Permitted
CC BY-NC
Rating
0.0 stars

Students write statistical questions that can be used to find information about a typical sixth grade student. Then, the class works together to informally plan how to find the typical arm span of a student in their class.Key ConceptsStatistical thinking, in large part, must deal with variability; statistical problem solving and decision making depend on understanding, explaining, and quantifying the variability in the data.“How tall is a sixth grader?” is a statistical question because all sixth graders are not the same height—there is variability.Goals and Learning ObjectivesUnderstand what a statistical question is.Realize there is variability in data and understand why.Describe informally the range, median, and mode of a set of data.

Subject:
Statistics and Probability
Material Type:
Lesson Plan
Date Added:
09/21/2015
Statistical Analysis of Methods to Repair Cracked Steel
Read the Fine Print
Educational Use
Rating
0.0 stars

Students apply pre-requisite statistics knowledge and concepts learned in an associated lesson to a real-world state-of-the-art research problem that asks them to quantitatively analyze the effectiveness of different cracked steel repair methods. As if they are civil engineers, students statistically analyze and compare 12 sets of experimental data from seven research centers around the world using measurements of central tendency, five-number summaries, box-and-whisker plots and bar graphs. The data consists of the results from carbon-fiber-reinforced polymer patched and unpatched cracked steel specimens tested under the same stress conditions. Based on their findings, students determine the most effective cracked steel repair method, create a report, and present their results, conclusions and recommended methods to the class as if they were presenting to the mayor and city council. This activity and its associated lesson are suitable for use during the last six weeks of the AP Statistics course; see the topics and timing note for details.

Subject:
Statistics and Probability
Material Type:
Activity/Lab
Provider:
TeachEngineering
Provider Set:
TeachEngineering
Author:
Botong Zheng
Miguel R. Ramirez
Mina Dawood
Date Added:
02/17/2017
Interpreting Statistics: A Case of Muddying the Waters
Only Sharing Permitted
CC BY-NC-ND
Rating
0.0 stars

This lesson unit is intended to help teachers assess how well students are able to: interpret data and evaluate statistical summaries; and critique someone elseŐs interpretations of data and evaluations of statistical summaries. The lesson also introduces students to the dangers of misapplying simple statistics in real-world contexts, and illustrates some of the common abuses of statistics and charts found in the media.

Subject:
Statistics and Probability
Material Type:
Assessment
Lesson Plan
Provider:
Shell Center for Mathematical Education
Provider Set:
Mathematics Assessment Project (MAP)
Date Added:
04/26/2013
6.SP.1 Identifying Statistical Questions
Unrestricted Use
CC BY
Rating
0.0 stars

This is a task from the Illustrative Mathematics website that is one part of a complete illustration of the standard to which it is aligned. Each task has at least one solution and some commentary that addresses important asects of the task and its potential use. Here are the first few lines of the commentary for this task: Which of the following are statistical questions? (A statistical question is one that can be answered by collecting data and where there will be variab...

Subject:
Mathematics
Material Type:
Activity/Lab
Provider:
Illustrative Mathematics
Provider Set:
Illustrative Mathematics
Author:
Illustrative Mathematics
Date Added:
09/08/2013
Statistical Analysis of Flexible Circuits
Read the Fine Print
Educational Use
Rating
0.0 stars

Students are introduced to the technology of flexible circuits, some applications and the photolithography fabrication process. They are challenged to determine if the fabrication process results in a change in the circuit dimensions since, as circuits get smaller and smaller (nano-circuits), this could become very problematic. The lesson prepares students to conduct the associated activity in which they perform statistical analysis (using Excel® and GeoGebra) to determine if the circuit dimension sizes before and after fabrication are in fact statistically different. A PowerPoint® presentation and post-quiz are provided. This lesson and its associated activity are suitable for use during the last six weeks of the AP Statistics course; see the topics and timing note for details.

Subject:
Mathematics
Statistics and Probability
Material Type:
Lesson
Provider:
TeachEngineering
Provider Set:
TeachEngineering
Author:
Cunjiang Yu
Miguel R. Ramirez
Minwei Xu
Song Chen
Date Added:
02/17/2017
Algebra I Module 2: Descriptive Statistics
Conditional Remix & Share Permitted
CC BY-NC-SA
Rating
0.0 stars

In this module, students reconnect with and deepen their understanding of statistics and probability concepts first introduced in Grades 6, 7, and 8. Students develop a set of tools for understanding and interpreting variability in data, and begin to make more informed decisions from data. They work with data distributions of various shapes, centers, and spreads. Students build on their experience with bivariate quantitative data from Grade 8. This module sets the stage for more extensive work with sampling and inference in later grades.

Find the rest of the EngageNY Mathematics resources at https://archive.org/details/engageny-mathematics.

Subject:
Statistics and Probability
Material Type:
Module
Provider:
New York State Education Department
Provider Set:
EngageNY
Date Added:
08/01/2013
Statistics Project: Sampling, Standard Deviation & Z-Scores
Conditional Remix & Share Permitted
CC BY-NC-SA
Rating
0.0 stars

In this statistics project, students will begin by sampling a population to answer their own designed question.  They will then use their sample to graph, find the mean and standard deviation, and illustrate their understanding of normal distribution.  They will then manipulate their data to make it "normal" and, after finding new samples, analyze the associated z-score and percents of that new data.

Subject:
Statistics and Probability
Material Type:
Lesson Plan
Author:
Melissa Hesterman
Date Added:
12/07/2017
Applying Statistics to Nano-Circuit Dimensions in Fabrication
Read the Fine Print
Educational Use
Rating
0.0 stars

Measuring the dimensions of nano-circuits requires an expensive, high-resolution microscope with integrated video camera and a computer with sophisticated imaging software, but in this activity, students measure nano-circuits using a typical classroom computer and (the free-to-download) GeoGebra geometry software. Inserting (provided) circuit pictures from a high-resolution microscope as backgrounds in GeoGebra's graphing window, students use the application's tools to measure lengths and widths of circuit elements. To simplify the conversion from the on-screen units to the real circuits' units and the manipulation of the pictures, a GeoGebra measuring interface is provided. Students export their data from GeoGebra to Microsoft® Excel® for graphing and analysis. They test the statistical significance of the difference in circuit dimensions, as well as obtain a correlation between average changes in original vs. printed circuits' widths. This activity and its associated lesson are suitable for use during the last six weeks of the AP Statistics course; see the topics and timing note below for details.

Subject:
Mathematics
Statistics and Probability
Material Type:
Activity/Lab
Provider:
TeachEngineering
Provider Set:
TeachEngineering
Author:
Cunjiang Yu
Miguel R. Ramirez
Minwei Xu
Song Chen
Date Added:
02/17/2017
Evaluate This! Drawing Conclusions with Statistics
Conditional Remix & Share Permitted
CC BY-NC-SA
Rating
0.0 stars

This is a text-based STEM Inquiry, focusing on the mathematical standard of making inferences and justifying conclusions while evaluating reports based on data. The unit culminates in students presenting their findings comparing local to national data regarding the relationships between educational attainment and financial earnings.

Subject:
Education
Mathematics
Material Type:
Unit of Study
Author:
Kim Carter
Alaura Carson
Jen Spoerke
Date Added:
10/17/2017
Regression
Conditional Remix & Share Permitted
CC BY-NC-SA
Rating
3.0 stars

This applet from Statistical Java allows the user to generate bivariate data for analysis with simple linear regression. The page describes the equations used to generate the data and estimate the regression lines.

Subject:
Statistics and Probability
Material Type:
Activity/Lab
Provider:
Consortium for the Advancement of Undergraduate Statistics Education
Provider Set:
Causeweb.org
Author:
Anderson-Cook, C.
C.Anderson-Cook
Dorai-Raj, S.
Robinson, T.
S.Dorai-Raj
T.Robinson
Date Added:
02/16/2011
ACC Basketball
Conditional Remix & Share Permitted
CC BY-NC-SA
Rating
0.0 stars

The students will use ACC basketball statistics to practice the process of converting fractions to decimals then to percents and will learn how to create and edit a spreadsheet. They will then use this spreadsheet to analyze their data. This unit is done during the basketball season which takes approximately 15 weeks from the middle of November to the middle of March. Teachers must have Clarisworks to open the sample spreadsheet in the lesson, but may recreate it in another spreadsheet program.

Subject:
Statistics and Probability
Material Type:
Lesson Plan
Provider:
University of North Carolina at Chapel Hill School of Education
Provider Set:
LEARN NC Lesson Plans
Author:
Susan Dougherty
Date Added:
07/14/2000
Election Poll, Variation 3
Unrestricted Use
CC BY
Rating
0.0 stars

This task introduces the fundamental statistical ideas of using data summaries (statistics) from random samples to draw inferences (reasoned conclusions) about population characteristics (parameters). In the task built around an election poll scenario, the population is the entire seventh grade class, the unknown characteristic (parameter) of interest is the proportion of the class members voting for a specific candidate, and the sample summary (statistic) is the observed proportion of voters favoring the candidate in a random sample of class members.

Subject:
Mathematics
Statistics and Probability
Material Type:
Activity/Lab
Provider:
Illustrative Mathematics
Provider Set:
Illustrative Mathematics
Author:
Illustrative Mathematics
Date Added:
05/01/2012
Election Poll, Variation 2
Unrestricted Use
CC BY
Rating
0.0 stars

This task introduces the fundamental statistical ideas of using data summaries (statistics) from random samples to draw inferences (reasoned conclusions) about population characteristics (parameters). In the task built around an election poll scenario, the population is the entire seventh grade class, the unknown characteristic (parameter) of interest is the proportion of the class members voting for a specific candidate, and the sample summary (statistic) is the observed proportion of voters favoring the candidate in a random sample of class members.

Subject:
Mathematics
Statistics and Probability
Material Type:
Activity/Lab
Provider:
Illustrative Mathematics
Provider Set:
Illustrative Mathematics
Author:
Illustrative Mathematics
Date Added:
05/01/2012
Election Poll, Variation 1
Unrestricted Use
CC BY
Rating
0.0 stars

This task introduces the fundamental statistical ideas of using data summaries (statistics) from random samples to draw inferences (reasoned conclusions) about population characteristics (parameters). In the task built around an election poll scenario, the population is the entire seventh grade class, the unknown characteristic (parameter) of interest is the proportion of the class members voting for a specific candidate, and the sample summary (statistic) is the observed proportion of voters favoring the candidate in a random sample of class members.

Subject:
Mathematics
Statistics and Probability
Material Type:
Activity/Lab
Provider:
Illustrative Mathematics
Provider Set:
Illustrative Mathematics
Author:
Illustrative Mathematics
Date Added:
05/01/2012
AP Stats Curriculum — Skew The Script
Conditional Remix & Share Permitted
CC BY-NC-SA
Rating
5.0 stars

A full AP® Statistics curriculum that explores relevant data in social issues, economics, medicine, sports, and more. The sequence works well in conjunction with the course CED and the most widely-used AP® Statistics textbooks.

Subject:
Mathematics
Statistics and Probability
Material Type:
Activity/Lab
Lesson
Lesson Plan
Author:
Skew The Script
Date Added:
01/31/2023
Math, Grade 6, Distributions and Variability, Matching Stats With Line Plots
Conditional Remix & Share Permitted
CC BY-NC
Rating
0.0 stars

Lesson OverviewStudents complete a card sort that requires them to match sets of statistics with the corresponding line plots.Students match cards with simple line plots to the corresponding card with measures of center. Some cards include mode, mean, median, and range, and some have one or two measures missing.  Students discuss how they determined which cards would match.Key ConceptsTo complete the card sort in this lesson efficiently, students must be able to relate statistical measures with line plots. If they start with the measures that are easy to see, they can narrow down the possible matches.The mode is the easiest measure to see immediately. It is simply the number with the tallest column of dots.The range can be found easily by subtracting the least value in the plot from the greatest.The median can be found fairly quickly by counting to the middle dot or by pairing dots on the ends until reaching the middle.The mean must be calculated by adding data values and dividing.Goals and Learning ObjectivesApply knowledge of measures of center and range to solve problems.Discuss and review strategy choices when problem solving.

Subject:
Statistics and Probability
Material Type:
Lesson Plan
Date Added:
09/21/2015
Accuracy of Carbon 14 Dating I
Unrestricted Use
CC BY
Rating
0.0 stars

This task examines, from a mathematical and statistical point of view, how scientists measure the age of organic materials by measuring the ratio of Carbon 14 to Carbon 12. The focus here is on the statistical nature of such dating. This task addresses a very important issue about precision in reporting and understanding statements in a realistic scientific context.

Subject:
Mathematics
Material Type:
Activity/Lab
Provider:
Illustrative Mathematics
Provider Set:
Illustrative Mathematics
Author:
Illustrative Mathematics
Date Added:
09/13/2012
Describing Distributions
Unrestricted Use
CC BY
Rating
0.0 stars

This is a task from the Illustrative Mathematics website that is one part of a complete illustration of the standard to which it is aligned. Each task has at least one solution and some commentary that addresses important aspects of the task and its potential use.

Subject:
Statistics and Probability
Material Type:
Activity/Lab
Provider:
Illustrative Mathematics
Provider Set:
Illustrative Mathematics
Author:
Illustrative Mathematics
Date Added:
08/06/2015
S-ID Measuring Variability in a Data Set
Unrestricted Use
CC BY
Rating
0.0 stars

This is a task from the Illustrative Mathematics website that is one part of a complete illustration of the standard to which it is aligned. Each task has at least one solution and some commentary that addresses important aspects of the task and its potential use.

Subject:
Statistics and Probability
Material Type:
Activity/Lab
Provider:
Illustrative Mathematics
Provider Set:
Illustrative Mathematics
Author:
Illustrative Mathematics
Date Added:
08/06/2015
6.SP Average Number of Siblings
Unrestricted Use
CC BY
Rating
0.0 stars

This is a task from the Illustrative Mathematics website that is one part of a complete illustration of the standard to which it is aligned. Each task has at least one solution and some commentary that addresses important aspects of the task and its potential use.

Subject:
Statistics and Probability
Material Type:
Activity/Lab
Provider:
Illustrative Mathematics
Provider Set:
Illustrative Mathematics
Author:
Illustrative Mathematics
Date Added:
08/06/2015
Understanding the Standard Deviation
Unrestricted Use
CC BY
Rating
0.0 stars

This is a task from the Illustrative Mathematics website that is one part of a complete illustration of the standard to which it is aligned. Each task has at least one solution and some commentary that addresses important aspects of the task and its potential use.

Subject:
Statistics and Probability
Material Type:
Activity/Lab
Provider:
Illustrative Mathematics
Provider Set:
Illustrative Mathematics
Author:
Illustrative Mathematics
Date Added:
08/06/2015
Math, Grade 6, Distributions and Variability
Rating
0.0 stars

Distributions and Variability

Type of Unit: Project

Prior Knowledge

Students should be able to:

Represent and interpret data using a line plot.
Understand other visual representations of data.

Lesson Flow

Students begin the unit by discussing what constitutes a statistical question. In order to answer statistical questions, data must be gathered in a consistent and accurate manner and then analyzed using appropriate tools.

Students learn different tools for analyzing data, including:

Measures of center: mean (average), median, mode
Measures of spread: mean absolute deviation, lower and upper extremes, lower and upper quartile, interquartile range
Visual representations: line plot, box plot, histogram

These tools are compared and contrasted to better understand the benefits and limitations of each. Analyzing different data sets using these tools will develop an understanding for which ones are the most appropriate to interpret the given data.

To demonstrate their understanding of the concepts, students will work on a project for the duration of the unit. The project will involve identifying an appropriate statistical question, collecting data, analyzing data, and presenting the results. It will serve as the final assessment.

Subject:
Mathematics
Statistics and Probability
Material Type:
Unit of Study
Provider:
Pearson
S-ID Measuring Variability in a Data Set
Unrestricted Use
CC BY
Rating
0.0 stars

This is a task from the Illustrative Mathematics website that is one part of a complete illustration of the standard to which it is aligned. Each task has at least one solution and some commentary that addresses important aspects of the task and its potential use.

Subject:
Statistics and Probability
Material Type:
Activity/Lab
Provider:
Illustrative Mathematics
Provider Set:
Illustrative Mathematics
Author:
Illustrative Mathematics
Date Added:
08/06/2015
Is It Center or Is It Variability?
Unrestricted Use
CC BY
Rating
0.0 stars

This is a task from the Illustrative Mathematics website that is one part of a complete illustration of the standard to which it is aligned. Each task has at least one solution and some commentary that addresses important aspects of the task and its potential use.

Subject:
Statistics and Probability
Material Type:
Activity/Lab
Provider:
Illustrative Mathematics
Provider Set:
Illustrative Mathematics
Author:
Illustrative Mathematics
Date Added:
08/06/2015
Beyond facts and statistics: Restoring order to how we understand logos in writing
Conditional Remix & Share Permitted
CC BY-NC-SA
Rating
0.0 stars

This resource aims to generate ideas and possibilities about how to advance student understanding of logic in writing beyond the notion that logic is always a collection of data points or a reference to facts. Instead of reducing logic to numbers and statements, this source hopes to introduce students and teachers to the existential questions that are always involved in the logical appeals of a text: how do we know what we know and why does it matter?

Subject:
Literature
Philosophy
Composition and Rhetoric
Reading Literature
Material Type:
Activity/Lab
Homework/Assignment
Lecture Notes
Author:
Bryan Harvey
Date Added:
12/21/2019
Curve Fitting
Unrestricted Use
CC BY
Rating
0.0 stars

With your mouse, drag data points and their error bars, and watch the best-fit polynomial curve update instantly. You choose the type of fit: linear, quadratic, cubic, or quartic. The reduced chi-square statistic shows you when the fit is good. Or you can try to find the best fit by manually adjusting fit parameters.

Subject:
Mathematics
Material Type:
Simulation
Provider:
University of Colorado Boulder
Provider Set:
PhET Interactive Simulations
Author:
Michael Dubson
Trish Loeblein
Date Added:
08/01/2008
Do You Fit In This Car?
Unrestricted Use
CC BY
Rating
0.0 stars

This task requires students to use the normal distribution as a model for a data distribution. Students must use given means and standard deviations to approximate population percentages. There are several ways (tables, graphing calculators, or statistical software) that students might calculate the required normal percentages. Depending on the method used, answers might vary somewhat from those shown in the solution.

Subject:
Mathematics
Material Type:
Activity/Lab
Provider:
Illustrative Mathematics
Provider Set:
Illustrative Mathematics
Author:
Illustrative Mathematics
Date Added:
01/02/2013
Electoral College
Unrestricted Use
CC BY
Rating
0.0 stars

n addition to providing a task that relates to other disciplines (history, civics, current events, etc.), this task is intended to demonstrate that a graph can summarize a distribution as well as provide useful information about specific observations.

Subject:
Mathematics
Statistics and Probability
Material Type:
Activity/Lab
Provider:
Illustrative Mathematics
Provider Set:
Illustrative Mathematics
Author:
Illustrative Mathematics
Date Added:
01/20/2013
Math, Grade 7, Samples and Probability, Sampling In Relation To Probability
Conditional Remix & Share Permitted
CC BY-NC
Rating
0.0 stars

Students are introduced to the concept of sampling as a method of determining characteristics of a population. They consider how a sample can be random or biased, and think of methods for randomly sampling a population to ensure that it is representative.The idea of sampling is connected to probability; a relatively small set of data (a random sample/number of trials) can be used to generalize about a population (or determine probability). A larger sample (more trials) will give more confidence in the conclusions, but how large of a sample is needed?Students also discuss what random means and how to generate a random sample. Random samples are compared to biased samples and give insight into how statistics can be misleading (intentionally or otherwise).Key ConceptsRandom samples are related to probability. In probability, the number of trials is a sample used to generalize about the probability of an event. The results in probability are random if we are looking at equally likely outcomes. If a data sample is not random, the conclusions about the population will not reflect it.Terminology introduced in this lesson:population: the entire set of objects that can be considered when asking a statistical questionsample: a subset of a population; can be random, where each object in the population is equally likely to be in the sample, or biased, where not every object in the population is equally likely to be in the sampleGoals and Learning ObjectivesIntroduce sampling as a method to generalize about a population.Discuss the concept of a random sample versus a biased sample.Determine methods to generate random samples.Understand that biased samples are sometimes used to mislead.SWD: Some students with disabilities will benefit from a preview of the goals in this lesson. Students can highlight the critical features and/or concepts and will help them to pay close attention to salient information.

Subject:
Statistics and Probability
Material Type:
Lesson Plan
Date Added:
09/21/2015
Using Data Representations to Make Substantiated Claims in Historical and Literary Contexts
Conditional Remix & Share Permitted
CC BY-NC
Rating
0.0 stars

This is an interdisciplinary lesson that incorporates tools learned in Algebra about analyzing data representations to apply to historical and literary purposes.

Subject:
English Language Arts
Material Type:
Lesson Plan
Author:
Jah-Yee Woo
Sarah Ahmed
Johanna Langill
Date Added:
04/03/2015
Estimating the Mean State Area
Unrestricted Use
CC BY
Rating
0.0 stars

The task is designed to show that random samples produce distributions of sample means that center at the population mean, and that the variation in the sample means will decrease noticeably as the sample size increases. Random sampling (like mixing names in a hat and drawing out a sample) is not a new idea to most students, although the terminology is likely to be new.

Subject:
Mathematics
Statistics and Probability
Material Type:
Activity/Lab
Provider:
Illustrative Mathematics
Provider Set:
Illustrative Mathematics
Author:
Illustrative Mathematics
Date Added:
05/01/2012
Math, Grade 6, Distributions and Variability, Characteristics Of Data
Conditional Remix & Share Permitted
CC BY-NC
Rating
0.0 stars

Students critique and improve their work on the Self Check from Lesson 13.Key ConceptsMeasures of spread (five-number summary) show characteristics of the data. It is possible to generate an appropriate data set with this information.Goals and Learning ObjectivesApply knowledge of statistics to solve problems.Identify the five-number summary, and understand measures of center and use their properties to solve problems.Track and review choice of strategy when problem solving.

Subject:
Statistics and Probability
Material Type:
Lesson Plan
Date Added:
09/21/2015
Why Randomize?
Unrestricted Use
CC BY
Rating
0.0 stars

This exercise demonstrates that judgment (non-random) samples tend to be biased in the sense that they produce samples that are not balanced with respect to the population characteristics of interest.

Subject:
Mathematics
Material Type:
Activity/Lab
Provider:
Illustrative Mathematics
Provider Set:
Illustrative Mathematics
Author:
Illustrative Mathematics
Date Added:
05/01/2012
Math, Grade 6, Distributions and Variability, Collecting & Organizing Data
Conditional Remix & Share Permitted
CC BY-NC
Rating
0.0 stars

Students collect data to answer questions about a typical sixth grade student. Students collect data about themselves, working in pairs to measure height, arm span, etc. Students discuss characteristics they would like to know about sixth grade students, adding these topics to a preset list. Data are collected and organized such that there is a class data set for each topic for future use. Students are asked to think about how this data could be represented and organized.Key ConceptsFor data to be useful, it must be collected in a consistent and accurate way. For example, for height data, students must agree on whether students should be measured with shoes on or off, and whether heights should be measured to the nearest inch, half inch, or centimeter.Goals and Learning ObjectivesGather data about sixth grade students.Consider how data are collected.

Subject:
Statistics and Probability
Material Type:
Lesson Plan
Date Added:
09/21/2015