In this 45-60 minute high-stakes board game, everyone wins or everyone loses. …
In this 45-60 minute high-stakes board game, everyone wins or everyone loses. As they play, groups of three to four children ages 8 to 13 build an understanding of how human actions impact global change. As teams, children play a game in which chance and choice determine the fate of a lone polar bear on an ice floe.
Using a combination of clickable 360 degree landscapes, 2D and 3D videos, …
Using a combination of clickable 360 degree landscapes, 2D and 3D videos, animations, interviews with scientists, and mini-games, the Polar Lab takes players onto the glacier ice and into the lab in search of evidence to answer big questions about Earth's climateâpast, present, and future. They search for plant and animal fossils that can reveal what this Arctic and Antarctic environment was like 50 million years ago. Students examine two kinds of clues that act as time capsules for exploring the past: mud cores and ice cores. Finally, students examine the rapid retreat of the massive glaciers and sea ice to better understand how changing ice conditions affect animals.
To prepare for this exercise, students will read about the Earth's energy …
To prepare for this exercise, students will read about the Earth's energy balance, the electromagnetic spectrum (including visible solar and invisible infrared energy), the effect of the earth's atmosphere, and the earth's resulting general oceanic and atmospheric circulation. For this I like Chapters 3, 4, & 5 in "The Earth System" (2nd Ed.) by Kump, Kasting, & Crane. The students' first step is to estimate zonal averages of Incoming Solar (Shortwave), Absorbed Shortwave, and Outgoing Longwave Radiation from 11x17in color maps of Earth Radiation Budget Experiment (ERBE) data. Then I remix the groups and they create zonal averages of these data at particular longitudes (like Fig. 2-14 in Ruddiman, "Earth's Climate: Past & Future").
(Note: this resource was added to OER Commons as part of a batch upload of over 2,200 records. If you notice an issue with the quality of the metadata, please let us know by using the 'report' button and we will flag it for consideration.)
In this syllabus from Fall 2022, Dr. Kaden Paulson-Smith provides bibliographic citations …
In this syllabus from Fall 2022, Dr. Kaden Paulson-Smith provides bibliographic citations and annotations for resources used in place of a traditional textbook. These resources include a combination of freely available resources; research, articles, and chapters supplied by the UWGB Libraries; and fair use of traditionally copyrighted materials. Course topics include: States; Civil Society; Social Identities and Culture; Global Inequality; Development; Democracy and Representation; Human Rights; War and Conflict; Migration; Global Health; and Climate Change.
Students in a Population and Community Ecology class participate in coastal marine …
Students in a Population and Community Ecology class participate in coastal marine research focused on understanding factors determining population sizes and community interactions, particularly in the context of species that appear to be shifting their ranges with climate change. Students participate in all aspects of the research from making observations and collecting data in the field to defining questions, stating hypothesis, designing and completing statistical analysis, and interpreting and presenting results. The outcomes are a research proposal, research paper, and poster presentation. All are intended to be at a level appropriate for use as a writing sample or presentation at undergraduate conferences. Results are incorporated into the ongoing research project led by the course instructor and graduate student teaching assistant.
(Note: this resource was added to OER Commons as part of a batch upload of over 2,200 records. If you notice an issue with the quality of the metadata, please let us know by using the 'report' button and we will flag it for consideration.)
Nachhaltige Digitalisierung ist eine Digitalisierung, die sich einbettet in die Werte und …
Nachhaltige Digitalisierung ist eine Digitalisierung, die sich einbettet in die Werte und Normen der Gesellschaft sowie die planetaren Grenzen beachtet. Um zur Umsetzung von nachhaltiger Digitalisierung beizutragen, hat die Volkshochschule Bonn im Rahmen der Learning City Bonn ein modular aufgebautes Weiterbildungsangebot für die DozentInnen entwickelt und stellt es Volkshochschulen und anderen Einrichtungen der Weiterbildung zur Verfügung. abei ist die Kernfrage: Wie können Dozent*innen unterstützt werden, Aspekte einer nachhaltigen Digitalisierung zu beachten und zu vermitteln? Wir verstehen dabei nachhaltige Digitalisierung als Querschnittsthema, das mit unterschiedlichen Schwerpunkten je nach Kurs und Format zur Anwendung kommen kann. Dozent*innen werden sowohl als Weiterbildungsakteure sowie als Multiplikator*innen angesprochen. Als Themenfelder nachhaltiger Digitalisierung wurden erarbeitet: Teilhabe, Klima- und Ressourcenschutz, Privatheit, Selbstbestimmung und Wohlbefinden.
Die Praxisboxen umfassen (für den Anfang) folgende Module: - Ökologischer Rucksack des Smartphones“ - „Always on? Klimasensibel lehren“ - „Digital inklusiv – Vielfalt online ermöglichen“ - „Downsizing“ - „Sharing is caring“ - „Gemeinsam Spaß statt Social Distancing“ - "#StopFakeNews" - „Mit Mehrdeutigkeit und Widersprüchen gut leben“ - „Wenn Du nichts bezahlst, bist Du das Produkt!“
Die Praxisboxen sind nach einer jeweils gleichen Systematik aufgebaut, die sich auf Lehr-Lernsituation sowie die Herausforderung der nachhaltigen Digitalisierung bezieht. Sie stellen praxisorientiert Handlungsmöglichkeiten, Tipps sowie Impulse zur Übertragung des Themas auf eigene Kontexte dar. Hinweise zum Weiterlesen werden gegeben. Die Praxisboxen können nach Bedarf ausgewählt werden.
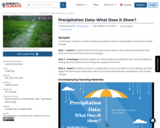
SYNOPSIS: In this lesson, students use New Jersey precipitation data to create …
SYNOPSIS: In this lesson, students use New Jersey precipitation data to create graphs and discuss climate change.
SCIENTIST NOTES: This lesson has students working on their data analysis skills through the use of graphs which help students to interpret New Jersey’s precipitation data and how it relates to climate change. A class discussion encourages students to think critically about the raw data. Students then work independently to graph the precipitation over time, finding a line of best fit and the equation for the line. This is followed by a discussion of the relationship between time and precipitation. Data forecasting is touched upon when students are asked to think about what data they would need next and what is predictable about the data. Students then choose one of two choices that allow them to compare and contrast visually represented data. This is a well-rounded lesson that relays the information of climate change through graphing and data analysis and is recommended for teaching.
POSITIVES: -This lesson can be used independently to practice application of math and reasoning skills or as ang point for longer research into data displays. -Students can use graph paper or any digital platform schools and teachers are already familiar with. -Students are given voice and choice in this lesson. -Students learn to apply math skills to current situations to explore and explain relationships in nature. -Students defend their chosen quantities and levels of accuracy in displaying data.
ADDITIONAL PREREQUISITES: -Students should have some basic understanding of graphing, plotting points, and the relationship between x & y-axes. -Students should have a basic idea of an equation of a line, line of best fit, and slope. -Students should have a basic understanding of other types and purposes of graphs and charts.
DIFFERENTIATION: -Teachers can adjust the degree of difficulty based on the math level of each class. -If using a digital graphing platform, teachers and students can manipulate data to explore related questions. -Teachers can explore deeper the purpose of different kinds of graphs in highlighting different parts of the same data set. -Teachers can bring in a variety of graphs from scientific journals or magazines, such as National Geographic, as instructional tools. -Teachers can extend this project to have students or classes graph the relationship between precipitation and time for all 50 states. Students can then display their graphs and conclusions. Teachers can moderate discussions comparing and contrasting various states and regions or make a conclusion as a whole. -Using the same website resources, students can explore the average maximum and minimum temperature table. They can explore the relationship between temperature and precipitation using various graphs. Teachers can then use this to discuss causation and/or correlation. -Teachers can use the lesson to introduce causation and correlation, asking students if there is a correlation between precipitation and climate change.
This short video explains how climate change can lead to more extreme …
This short video explains how climate change can lead to more extreme precipitation events and more frequent flooding. Information from the CDC has succinct information about the health downsides of extreme precipitation events, including mental health impacts.
The students must use crayons or colored pencils to create maps of …
The students must use crayons or colored pencils to create maps of global precipitation and evaporation rates. One worksheet is provided to each group of students. Then a representative from each group explains their map to the rest of the class, and the instructor shows a similar map from NOAA or NASA.
(Note: this resource was added to OER Commons as part of a batch upload of over 2,200 records. If you notice an issue with the quality of the metadata, please let us know by using the 'report' button and we will flag it for consideration.)
For irrigated crops, knowing when and how much water to apply has …
For irrigated crops, knowing when and how much water to apply has long been a matter of experience and guesswork. In a changing climate, new technology can reduce this uncertainty, enabling farmers to make every drop of water count.
This resource is a video abstract of a research paper created by …
This resource is a video abstract of a research paper created by Research Square on behalf of its authors. It provides a synopsis that's easy to understand, and can be used to introduce the topics it covers to students, researchers, and the general public. The video's transcript is also provided in full, with a portion provided below for preview:
"Climate change stands to have a tremendous impact on the world’s freshwater ecosystems. To understand how, researchers analyzed 15,289 functional genes related to nutrient cycling and stress processes gathered from biofilm microbes across mountainside streams in Norway, Spain, and China. With increasing elevation, microbial functional diversity tended to decline, and the composition of functional gene assemblages tended to differ more with greater elevational distances. These variations were more drastic as the environmental differences between the lowlands and the peaks increased. The best predictors of these variations appear to be climatic factors, such as temperature during the growing season. and winter precipitation. Including predictors at the local or landscape level could further refine the picture painted by these findings and help Eurasian countries anticipate significant alterations to their stream ecosystems amid a changing climate..."
The rest of the transcript, along with a link to the research itself, is available on the resource itself.
This activity in a case study format explores ice loss from the …
This activity in a case study format explores ice loss from the Greenland ice sheet by way of outlet glaciers that flow into the ocean. Students do basic calculations and learn about data trends, rates of change, uncertainty, and predictions.
This is an activity designed to allow students who have been exposed …
This is an activity designed to allow students who have been exposed to the El NiÃo-Southern Oscillation to analyze the La NiÃa mechanism and predict its outcomes in a case study format.
In this activity, students investigate soil erosion and how a changing climate …
In this activity, students investigate soil erosion and how a changing climate could influence erosion rates in agricultural areas. This activity is part of a larger InTeGrate module called Growing Concern.
As the number of ice-free days in the seas surrounding Alaska increases …
As the number of ice-free days in the seas surrounding Alaska increases over time, so do opportunities. Oil and gas companies are ramping up offshore exploration and drilling in the Arctic and the shipping industry is increasing traffic around and through the region. As a result, Arctic residents may have new opportunities for jobs and development across the region. Theres also a downside to the increased activity. Oil and gas extraction operations occasionally have accidentsevents that can result in massive oil spills.
This class introduces students to the interdisciplinary nature of 21st-century engineering projects …
This class introduces students to the interdisciplinary nature of 21st-century engineering projects with three threads of learning: a technical toolkit, a social science toolkit, and a methodology for problem-based learning. Students encounter the social, political, economic, and technological challenges of engineering practice by participating in real engineering projects with faculty and industry; this semester’s major project focuses on the engineering and economics of solar cells. Student teams will create prototypes and mixed media reports with exercises in project planning, analysis, design, optimization, demonstration, reporting and team building.
By the end of this section, you will be able to: Discuss …
By the end of this section, you will be able to:
Discuss the components of economic growth, including physical capital, human capital, and technology Explain capital deepening and its significance Analyze the methods employed in economic growth accounting studies Identify factors that contribute to a healthy climate for economic growth
No restrictions on your remixing, redistributing, or making derivative works. Give credit to the author, as required.
Your remixing, redistributing, or making derivatives works comes with some restrictions, including how it is shared.
Your redistributing comes with some restrictions. Do not remix or make derivative works.
Most restrictive license type. Prohibits most uses, sharing, and any changes.
Copyrighted materials, available under Fair Use and the TEACH Act for US-based educators, or other custom arrangements. Go to the resource provider to see their individual restrictions.