An original informational story about Sun's role in heating Earth's air, land, …
An original informational story about Sun's role in heating Earth's air, land, and water and Sun's connection to the seasons and weather. The story encourages young readers to observe Sun's impact on weather and the seasons and to make predictions about the weather. The story is available in separate versions for grades K-2 and 3-5 and as a downloadable, full-color pdf. The story is a feature of the free online magazine that focuses on the seven principles of climate literacy.
This video illustrates how one community developed and implemented a sustainable solution …
This video illustrates how one community developed and implemented a sustainable solution to help keep stream water cool enough for healthy fish. Their solution has the added benefit of removing CO2 from the atmosphere.
This activity is a Google Slide playlist. Students will analyze data from …
This activity is a Google Slide playlist. Students will analyze data from sediments collected off the coast of Santa Barbara, California to determine whether this information can be used to study historical climate change. This playlist is suitable for use in remote, hybrid, or in-person instruction and can easily be added to a Learning Management System.
Provenance: Molly Ludwick, Kings Mountain Middle School Reuse: This item is offered under a Creative Commons Attribution-NonCommercial-ShareAlike license http://creativecommons.org/licenses/by-nc-sa/3.0/ You may reuse this item for non-commercial purposes as long as you provide attribution and offer any derivative works under a similar license.
(Note: this resource was added to OER Commons as part of a batch upload of over 2,200 records. If you notice an issue with the quality of the metadata, please let us know by using the 'report' button and we will flag it for consideration.)
This series of activities is designed to introduce students to the role …
This series of activities is designed to introduce students to the role of sediments and sedimentary rocks in the global carbon cycle. Students learn how stable carbon isotopes can be used to reconstruct ancient sedimentary environments. Students will make some simple calculations, formulate hypotheses, and think about the implications of their results. The activity includes an optional demonstration of the density separation of a sediment sample into a light, organic fraction and a heavier, mineral fraction.
Student will use geospatial tools (WebGIS and/or ArcGIS 9.3) to create a …
Student will use geospatial tools (WebGIS and/or ArcGIS 9.3) to create a total of 4 original maps that begin to provide a solution to a real world environmental problem. The Project Problem Statement will guide the students project. Two of these maps may come from exercises if they are appropriate to answer the project problem statement. The project topics will be determined by the student from a list of topic options (e.g., climate, energy, agriculture, sustainable practices). Other topics may be approved at the discretion of the instructor. For example, a student may choose to create a map that will represent the various energy source option(s) in one region of the United States. All students will write a 2-3 page essay on their topic. References are required. Students essay and the 4 maps will be presented in various manners. Most students will use an electronic template and design their PowerPoint poster. With approval from the instructor, students can present their findings via a video (collaborate with video department), mural (collaborate with art department) or develop a Web page (Second Life or web page). Student projects may be highlighted at MCC functions (e.g., Sustainability Day, GIS Day, Scholars Day, and/or Earth Day). Some projects may continue each semester as new students take the course and begin where the last student left off. A sample project might describe the current climatic condition, recent climate changes, evaluate the various energy source option(s), and present an energy plan for the future in one region of the United States.
This demonstration is designed to show how the inputs and outputs of …
This demonstration is designed to show how the inputs and outputs of energy or mass in a system balance. Students create a reservoir model using a hose, a bucket, a tub with a drain and overflow triangle, a ruler, and water, to understand the inputs and outputs of a local watershed or reservoir. A worksheet accompanies the activity. The resource is supported by teacher background information, assessments, and a scoring rubric. This is Activity 1 of the learning module, Global Balance, part of the lesson series, Potential Consequences of Climate Variability and Change.
In this activity, students create a reservoir model using hoses, a bucket, …
In this activity, students create a reservoir model using hoses, a bucket, a flat pan, and water, to understand the inputs and outputs of a local watershed or reservoir. The resource is supported by teacher background information, assessment suggestions, and a scoring rubric. This is Activity 2 of the learning module, Global Balance, part of the lesson series, The Potential Consequences of Climate Variability and Change.
In this activity, students investigate the interacting parts of the Earth system …
In this activity, students investigate the interacting parts of the Earth system by observing changes in evaporation rate in four small aquariums with different initial conditions. The demonstration requires 4 small aquariums, soil, plants, water, graduated cylinder, scale, plastic wrap, and colored pencils. A student data sheet is included. The resource is supported by teacher background information, assessment suggestions, and a scoring rubric. This is Activity 3 in the learning module, Global Balance, part of the lesson series, The Potential Consequences of Climate Variability and Change.
In this pen and pencil activity, student teams use an inquiry approach …
In this pen and pencil activity, student teams use an inquiry approach to create their own model of the hydrological cycle. A calculator is needed for this activity. Teacher background information, assessment suggestions, and a scoring rubric are included.This is Activity 4 of the learning module, Global Balance, part of the lesson series, The Potential Consequences of Climate Variability and Change.
This issue of the free online magazine, Beyond Penguins and Polar Bears, …
This issue of the free online magazine, Beyond Penguins and Polar Bears, examines how elementary teachers can introduce the Arctic and Antarctica and use science, geography, literacy, and technology to help students compare and contrast these two dramatically different areas as well as their own home.
The Sentinel-2 10m Land Use/Land Cover time-series is live on ArcGIS Living …
The Sentinel-2 10m Land Use/Land Cover time-series is live on ArcGIS Living Atlas of the World! This map provides an annual assessment of yearly global land cover from 2017–2021, in 9 different land cover classes, at 10-meter resolution. The new time-series animates the natural and anthropogenic processes that continue to transform our planet's landscapes and resources, giving researchers, planners, and the GIS community the information they need to make critical future decisions.
This resource is a video abstract of a research paper created by …
This resource is a video abstract of a research paper created by Research Square on behalf of its authors. It provides a synopsis that's easy to understand, and can be used to introduce the topics it covers to students, researchers, and the general public. The video's transcript is also provided in full, with a portion provided below for preview:
"Dimethylsulfoniopropionate, or DMSP, is an organosulfur compound produced in huge quantities by organisms throughout the ocean. Understanding how marine organisms degrade and use DMSP has been the subject of research for more than 70 years, largely because DMSP is the precursor to the climate-active gas dimethyl sulfide (DMS), which aids in cloud formation. But a new study highlights one possibly overlooked detail in this area of study: major DMSP degraders aren’t necessarily using it as a carbon source. Researchers used isotope labelling (DNA-SIP) to identify microorganisms using DMSP as a carbon source in the North Sea. While metagenomic analyses suggested that Rhodobacterales and SAR11 bacteria were the major degraders of DMSP via demethylation, neither group was prominently labeled in DNA-SIP experiments, suggesting that they use DMSP as a source of sulfur but not of carbon. Instead, DNA-SIP pointed to gammaproteobacterial Oceanospirillales as the dominant microorganisms using DMSP as a carbon source..."
The rest of the transcript, along with a link to the research itself, is available on the resource itself.
This article describes glaciologist Lonnie Thompson's discovery of an ancient plant in …
This article describes glaciologist Lonnie Thompson's discovery of an ancient plant in Peru. It also illustrates some important characteristics of good science that can be seen even in a serendipitous discovery.
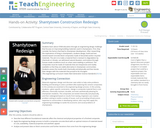
Students learn about STEM education through an engineering design challenge that focuses …
Students learn about STEM education through an engineering design challenge that focuses on improving building materials used in shantytowns. First, they consider the factors that lead to shantytown development. After researching the implications of living in shantytowns, students design, build and test cement-based concrete block composites made of discarded and/or recycled materials. The aim is to make a material that is resistant to degradation by chemicals or climate, can withstand natural disasters, and endure through human-made conditions (such as urban overcrowding or pollution). The composites must be made of materials that are inexpensive and readily available so that they are viable alternative in shantytown communities. Students assess the results both chemically and physically and then iterate their designs with the materials that proved to be strongest.
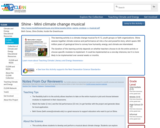
This learning activity is a climate change musical for K-12, youth groups …
This learning activity is a climate change musical for K-12, youth groups or faith organizations. Shine weaves together climate science and performance art into a fun and powerful story, which spans 300 million years of geological time to convey how humanity, energy, and climate are interrelated.
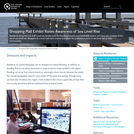
Residents along the U.S. Gulf Coast are familiar with the flooding hazards …
Residents along the U.S. Gulf Coast are familiar with the flooding hazards associated with storms, yet many are unaware of the risk of sea level rise. Shoppers at a local mall had a chance to explore the potential impacts of sea level rise on their communities.
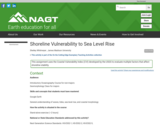
When students consider the causes of shoreline erosion they often assume waves …
When students consider the causes of shoreline erosion they often assume waves are the controlling process. Although they are correct there are other variables to consider. This assignment uses the Coastal Vulnerability Index (CVI) developed by the USGS to evaluate multiple factors that affect shoreline stability. The two sites used in this example- Virginia and Maine, were deliberately chosen because the wave height, i.e. wave energy, is almost the same but the erosion rates are different. Maine is more stable (lower CVI) than Virginia (high CVI), but waves are not the reason the stability of these two shorelines differ. This forces students to consider other variables such as underlying geology and sea level rise.
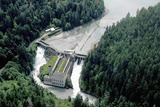
This inquiry unit leads students through the different perspectives behind a decision …
This inquiry unit leads students through the different perspectives behind a decision to have a dam removed. This unit looks at similar Washington state dam removal decisions as well as the complex issue of having the Election dam removed near Puyallup, WA. Students will be introduced to the stories and traditional ways of knowing about salmon that the Puyallup Tribe has built their culture upon. Then they will explore the science behind hydroelectricity and build models to discover how carbon neutral energy is gathered through hydro dams. This inquiry unit ends with students researching different perspectives surrounding the current (2021) decision to remove the Electron dam including: the Tribe’s Fishery department, the ecosystem, the city council, the fishermen and the hydro-electrical company who currently owns the dam. With their research, students will do a socratic seminar to mimic the court case lawsuit that is ongoing against the Electron Dam.
City officials in Tybee Island, Georgia, recognized sea level rise as a …
City officials in Tybee Island, Georgia, recognized sea level rise as a growing problem for their community. Visualizations from a sea level rise viewer helped them raise awareness of the city's vulnerabilities and led to development of Georgias first sea level rise plan.
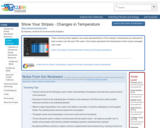
These 'warming stripe' graphics are visual representations of the change in temperature …
These 'warming stripe' graphics are visual representations of the change in temperature as measured in each country over the past 100+ years. Each stripe represents the temperature in that country averaged over a year.
No restrictions on your remixing, redistributing, or making derivative works. Give credit to the author, as required.
Your remixing, redistributing, or making derivatives works comes with some restrictions, including how it is shared.
Your redistributing comes with some restrictions. Do not remix or make derivative works.
Most restrictive license type. Prohibits most uses, sharing, and any changes.
Copyrighted materials, available under Fair Use and the TEACH Act for US-based educators, or other custom arrangements. Go to the resource provider to see their individual restrictions.