This is a teaching activity in which students learn about the connection …
This is a teaching activity in which students learn about the connection between CO2 emissions, CO2 concentration, and average global temperatures. Through a simple online model, students learn about the relationship between these and learn about climate modeling while predicting temperature change over the 21st century.
These five modules introduce secondary science teachers to a powerful resource, from …
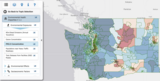
These five modules introduce secondary science teachers to a powerful resource, from the Washington State Department of Health, entitled the “Washington Tracking Network” (WTN). This is a tool for mapping (a) the distribution of numerous factors that influence public health, and (b) the inequitable distribution of health outcomes. This wonderful system naturally invites us to inquire about the intersections of biological, societal, and environmental issues. The overarching goal of these five modules is to support teachers to design student activities that (1) inspire and connect students to real world health & environmental data, and each other, (2) promote clean air, land, and water, (3) promote the use of the Washington Tracking Network data mapping system, (4) support equitable, 3-dimensional learning, including the use of community wisdom to solve public health issues, and (5) use science for student action and leadership in response to current and historical misuses of science. These modules were created in collaboration with epidemiologists and communications professionals from the Washington Department of Health.
In this lab activity students use the pH scale and the reaction …
In this lab activity students use the pH scale and the reaction of carbon dioxide with water to understand ocean acidification and make predictions regarding the effect of ocean acidification on marine organisms by experimentally determining the effect of pH of calcite dissolution.
(Note: this resource was added to OER Commons as part of a batch upload of over 2,200 records. If you notice an issue with the quality of the metadata, please let us know by using the 'report' button and we will flag it for consideration.)
This article provides tips and strategies for effectively integrating digital media into …
This article provides tips and strategies for effectively integrating digital media into classroom instruction. Resources provided are suitable for preschool and elementary students.
This video features interviews with native people living on atoll islands in …
This video features interviews with native people living on atoll islands in Micronesia, so viewers are able to understand the real, current threats that these people are facing due to climate change.
This resource is a video abstract of a research paper created by …
This resource is a video abstract of a research paper created by Research Square on behalf of its authors. It provides a synopsis that's easy to understand, and can be used to introduce the topics it covers to students, researchers, and the general public. The video's transcript is also provided in full, with a portion provided below for preview:
"Children in daycare centers are exposed to various bacteria and fungi. Exposure to certain indoor fungi can lead to adverse health effects, but the extent to which the fungal community, or mycobiome, affects children in daycares remains unclear. To learn more, a recent study investigated the indoor mycobiomes of two daycare centers in Norway over the course of a year. DNA metabarcoding of dust samples from the daycares revealed that less-used rooms had fungal communities similar to the outdoor mycobiome, which were markedly different from the communities in the main rooms. The less-used rooms tended to have more Basidiomycota species. while the main rooms had more Ascomycota species. The indoor mycobiome composition was also strongly affected by the outdoor climate, exhibiting clear seasonality..."
The rest of the transcript, along with a link to the research itself, is available on the resource itself.
This unit was developed for a junior level pre-Calculus class to be …
This unit was developed for a junior level pre-Calculus class to be taught during the first quarter of the 2016-17 school year. The lessons of the unit will culminate in each group of students creating and analyzing a mathematical model to predict the future impacts of climate change in New Hampshire and make a presentation as a group. The texts and historic data source, while specific to New Hampshire, may be of interest to other regions of the country. However, state climate change reports and climate data specific to your location may be available through state universities and meteorological stations.
Video clips from federal and regional agencies show scientists at work with …
Video clips from federal and regional agencies show scientists at work with tools used to collect data about the climate and weather. This article, from the free, online magazine Beyond Weather and the Water Cycle, will help students visualize the tools and how they are used in the atmosphere, at sea, and other hard-to-access locations.
Video mash-up projects are readily incorporated into science courses. They are information-dense, …
Video mash-up projects are readily incorporated into science courses. They are information-dense, require little or no in-class time group work, do not require a production phase, and provide an effective jigsaw mechanism for students to learn from each other.
(Note: this resource was added to OER Commons as part of a batch upload of over 2,200 records. If you notice an issue with the quality of the metadata, please let us know by using the 'report' button and we will flag it for consideration.)
This YouTube playlist contains the video recordings of the lectures presented by …
This YouTube playlist contains the video recordings of the lectures presented by scientists at the Ocean Acidification workshop on July 11th, 2012. Playlist also contains a variety of other related videos that can be used as teaching tools and/or resources.
For the assignment, the students are given a series of placemarks in …
For the assignment, the students are given a series of placemarks in Google Earth. Using Google Earth, the students 'fly' to various areas around the world. They examine the landforms at each placemark and answer questions regarding the formation of these features. Designed for a geomorphology course Uses online and/or real-time data Has minimal/no quantitative component
(Note: this resource was added to OER Commons as part of a batch upload of over 2,200 records. If you notice an issue with the quality of the metadata, please let us know by using the 'report' button and we will flag it for consideration.)
This is an anonymous electronic peer review exercise that utilizes a dropbox, …
This is an anonymous electronic peer review exercise that utilizes a dropbox, where students detail and support their viewpoint on nonhuman-induced global warming.
(Note: this resource was added to OER Commons as part of a batch upload of over 2,200 records. If you notice an issue with the quality of the metadata, please let us know by using the 'report' button and we will flag it for consideration.)
This is a virtual field trip to Iceland's Laki Fissure, which explores …
This is a virtual field trip to Iceland's Laki Fissure, which explores the 1783 eruption as a type example of a large historical lava flow eruption that had a significant impact on the local human population and the global environment. Students explore the climate impacts of the eruption, as well as the different types of volcanic deposits it produced. Students use their observations to develop hypotheses about past and future volcanic hazards associated with the volcano.
(Note: this resource was added to OER Commons as part of a batch upload of over 2,200 records. If you notice an issue with the quality of the metadata, please let us know by using the 'report' button and we will flag it for consideration.)
Students create an essay to respond to the question: "What virtues does …
Students create an essay to respond to the question: "What virtues does our society need to foster in people in order for us to be able to respond appropriately to climate change?"
(Note: this resource was added to OER Commons as part of a batch upload of over 2,200 records. If you notice an issue with the quality of the metadata, please let us know by using the 'report' button and we will flag it for consideration.)
Students will learn how to use a sequence of images to illustrate …
Students will learn how to use a sequence of images to illustrate the difference between sequestering and emitting carbon.
(Note: this resource was added to OER Commons as part of a batch upload of over 2,200 records. If you notice an issue with the quality of the metadata, please let us know by using the 'report' button and we will flag it for consideration.)
This activity introduces students to visualization capabilities available through NASA's Earth Observatory, …
This activity introduces students to visualization capabilities available through NASA's Earth Observatory, global map collection, NASA NEO and ImageJ. Using these tools, students build several animations of satellite data that illustrate carbon pathways through the Earth system.
Visualizing Energy is an open access, interdisciplinary science communication project that aims …
Visualizing Energy is an open access, interdisciplinary science communication project that aims to increase actionable knowledge about a sustainable and just energy transition. It uses engaging visualizations coupled with accessible data stories to communicate in clear, concise, jargon-free language. It is highly interdisciplinary and uses energy as an organizing principle to reveal logical connections across disciplines. Visualizing Energy knits data analysis, visualizations, and the written word into stories that promote critical thinking and communication. Its initial focus is on three interconnected areas: the connection between energy and human well-being; the history of energy transitions; and equity issues surrounding energy transitions (energy justice, energy burden, energy poverty, energy insecurity).
The project co-leaders are Cutler J. Cleveland, Professor of Earth and Environment, and Heather Clifford, data scientist in the Boston University Institute for Global Sustainability.
This visualization is a series of three short animations/videos that illustrate how …
This visualization is a series of three short animations/videos that illustrate how the changing ice sheets result in sea level rise. It uses satellite data to show how Greenland and Antarctica are losing mass at a rate of 283 gigatons per year and 145 gigatons per year, respectively. Simulation shows visualization of one gigaton and how much this translates to sea level rise.
In this natural science lab, students examine different soil profiles along a …
In this natural science lab, students examine different soil profiles along a hillside. Understanding about topsoil formation and conservation is then related to sustainable agriculture and carbon sequestration and its importance in mitigating climate change.
(Note: this resource was added to OER Commons as part of a batch upload of over 2,200 records. If you notice an issue with the quality of the metadata, please let us know by using the 'report' button and we will flag it for consideration.)
No restrictions on your remixing, redistributing, or making derivative works. Give credit to the author, as required.
Your remixing, redistributing, or making derivatives works comes with some restrictions, including how it is shared.
Your redistributing comes with some restrictions. Do not remix or make derivative works.
Most restrictive license type. Prohibits most uses, sharing, and any changes.
Copyrighted materials, available under Fair Use and the TEACH Act for US-based educators, or other custom arrangements. Go to the resource provider to see their individual restrictions.