Updating search results...

Search Resources

1923 Results

View
Selected filters:
  • Mathematics
  • Community College / Lower Division
Cengage
Unrestricted Use
CC BY
Rating
0.0 stars

Students first discover what they want from their education, then build a plan to get there. This content takes students through the steps to successfully navigate their journey in higher education. Topics include planning for success, choosing a career path, setting and attaining goals, understanding financial management, developing critical thinking skills, making healthy choices, using effective communication, managing time, developing learning strategies, developing meaningful relationships. Content is available in PDF and Open Document formats and is licensed CC BY. Learning Objectives also are provided. Full course offering available at https://www.cengage.com/c/opennow-college-success-1e-opennow-cengage

Subject:
Applied Science
Arts and Humanities
Business and Communication
Career and Technical Education
Education
English Language Arts
History
Law
Life Science
Mathematics
Physical Science
Social Science
Material Type:
Module
Reading
Textbook
Unit of Study
Date Added:
10/15/2018
Cengage OpenNow College Success Reading & Learning Objectives
Unrestricted Use
CC BY
Rating
0.0 stars

Students first discover what they want from their education, then build a plan to get there. This content takes students through the steps to successfully navigate their journey in higher education. Topics include planning for success, choosing a career path, setting and attaining goals, understanding financial management, developing critical thinking skills, making healthy choices, using effective communication, managing time, developing learning strategies, developing meaningful relationships. Content is available in PDF and Open Document formats and is licensed CC BY. Learning Objectives also are provided.

Subject:
Applied Science
Arts and Humanities
Business and Communication
Career and Technical Education
Education
English Language Arts
History
Law
Life Science
Mathematics
Physical Science
Social Science
Material Type:
Module
Reading
Textbook
Unit of Study
Date Added:
05/16/2018
The Central Limit Theorem
Conditional Remix & Share Permitted
CC BY-NC-SA
Rating
0.0 stars

The applets in this section of Statistical Java allow you to see how the Central Limit Theorem works. The main page gives the characteristics of five non-normal distributions (Bernoulli, Poisson, Exponential, U-shaped, and Uniform).

Subject:
Mathematics
Statistics and Probability
Material Type:
Activity/Lab
Provider:
Consortium for the Advancement of Undergraduate Statistics Education
Provider Set:
Causeweb.org
Author:
Anderson-Cook, C.
C. Anderson-Cook
Dorai-Raj, S.
Robinson, T.
S. Dorai-Raj
T. Robinson
Date Added:
02/16/2011
Central limit theorem
Conditional Remix & Share Permitted
CC BY-NC-SA
Rating
0.0 stars

This video talka about what is easily one of the most fundamental and profound concepts in statistics and maybe in all of mathematics. And that's the central limit theorem.

Subject:
Mathematics
Statistics and Probability
Material Type:
Lesson
Provider:
Khan Academy
Author:
Salman Khan
Date Added:
12/27/2017
Chaos in Population Dynamics -- Understanding Chaos in the Logistic Model
Conditional Remix & Share Permitted
CC BY-NC-SA
Rating
0.0 stars

Spreadsheets Across the Curriculum module. Students build spreadsheets to explore conditions that lead to chaotic behavior in logistic models of populations that grow discretely.

Subject:
Biology
Ecology
Geoscience
Life Science
Mathematics
Physical Science
Material Type:
Activity/Lab
Provider:
Science Education Resource Center (SERC) at Carleton College
Provider Set:
Pedagogy in Action
Author:
David McAvity
Date Added:
11/06/2014
Charts Are Like Pasta - Data Visualization Part 1: Crash Course Statistics #5
Read the Fine Print
Some Rights Reserved
Rating
0.0 stars

Today we're going to start our two-part unit on data visualization. Up to this point we've discussed raw data - which are just numbers - but usually it's much more useful to represent this information with charts and graphs. There are two types of data we encounter, categorical and quantitative data, and they likewise require different types of visualizations. Today we'll focus on bar charts, pie charts, pictographs, and histograms and show you what they can and cannot tell us about their underlying data as well as some of the ways they can be misused to misinform.

Subject:
Mathematics
Statistics and Probability
Material Type:
Lecture
Provider:
Complexly
Provider Set:
Crash Course Statistics
Date Added:
02/21/2018
Chemical Differentiation in the Palisades Sill
Conditional Remix & Share Permitted
CC BY-NC-SA
Rating
0.0 stars

The purpose of this assignment is for students to synthesize field observations, petrography, and whole-rock chemical analyses in order to investigate chemical differentiation processes in a basaltic magma chamber. The students first complete a petrography lab on both hand samples and thin sections that represent a complete stratigraphic section through sill at Fort Lee, NJ. I then provide them with major- and trace-element data and a table of distribution coefficients for common phases that would be crystallizing from basaltic magma. I then ask them to discuss the chemical differentiation of the sill by writing up a 1-2 page interpretative summary based on their petrographic observations and the chemical data.

(Note: this resource was added to OER Commons as part of a batch upload of over 2,200 records. If you notice an issue with the quality of the metadata, please let us know by using the 'report' button and we will flag it for consideration.)
Subject:
Biology
Chemistry
Life Science
Mathematics
Measurement and Data
Physical Science
Statistics and Probability
Material Type:
Activity/Lab
Data Set
Lesson Plan
Provider:
Science Education Resource Center (SERC) at Carleton College
Provider Set:
Teach the Earth
Author:
Matthew Gorring
Date Added:
08/06/2019
Chemical Equilibrium -- What Are the Characteristics of Equilibrium Reactions?
Conditional Remix & Share Permitted
CC BY-NC-SA
Rating
0.0 stars

Spreadsheets Across Curriculum module. Students build spreadsheets to compare the time course of a reaction that goes to completion to that of an equilibrium reaction.

Subject:
Chemistry
Mathematics
Physical Science
Material Type:
Activity/Lab
Provider:
Science Education Resource Center (SERC) at Carleton College
Provider Set:
Pedagogy in Action
Author:
cheryl coolidge
Date Added:
11/06/2014
Chemical Kinetics
Conditional Remix & Share Permitted
CC BY-NC
Rating
0.0 stars

We help students see the connection between college level chemistry course work and their differential equations coursework. We do this through modeling kinetics, or rates of chemical reaction. We offer many opportunities to model these chemical reactions with data, some of which comes from traditional introductory chemistry textbooks. We ask students to verify their model through parameter estimation. We use Excel’s Trendline addition to graphs/charts to select the models for the data and transformed data to take advantage of Trendline’s set function choices and we also use Mathematica’s direct nonlinear fitting capabilities.

Subject:
Applied Science
Mathematics
Physical Science
Material Type:
Activity/Lab
Author:
Brian Winkel
Date Added:
04/01/2017
Chi-Square Tests: Crash Course Statistics #29
Read the Fine Print
Some Rights Reserved
Rating
0.0 stars

Today we're going to talk about Chi-Square Tests - which allow us to measure differences in strictly categorical data like hair color, dog breed, or academic degree. We'll cover the three main Chi-Square tests: goodness of fit test, test of independence, and test of homogeneity. And explain how we can use each of these tests to make comparisons.

Subject:
Mathematics
Statistics and Probability
Material Type:
Lecture
Provider:
Complexly
Provider Set:
Crash Course Statistics
Date Added:
08/29/2018
Chi square test (08:54)
Only Sharing Permitted
CC BY-NC-ND
Rating
0.0 stars

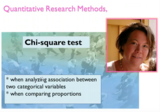
An introduction and examples of how to use the Chi square test. The test is used when analyzing assocation between two categorical variables and when comparing proportions. The idea behind the test is to compare the observed frequencies with the expected frequencies, if the two variables are unrelated.

Subject:
Applied Science
Health, Medicine and Nursing
Mathematics
Statistics and Probability
Material Type:
Lecture
Provider:
Umeå University
Provider Set:
Quantitative Research Methods
Author:
Marie Lindqvist
Associate professor in epidemiology and biostatistics
Date Added:
11/01/2014
Choosing Between Home Appliances: Benefits to the Planet and Your Wallet
Conditional Remix & Share Permitted
CC BY-NC-SA
Rating
0.0 stars

Students research various options for new appliances and make purchasing decisions based not merely on purchase price, but also on energy efficiency, which has implications for the planet AND for longer-term personal finances. Students calculate the "payback period" for the more energy efficient appliance and calculate long-term savings.

(Note: this resource was added to OER Commons as part of a batch upload of over 2,200 records. If you notice an issue with the quality of the metadata, please let us know by using the 'report' button and we will flag it for consideration.)
Subject:
Biology
Economics
Life Science
Mathematics
Social Science
Material Type:
Activity/Lab
Provider:
Science Education Resource Center (SERC) at Carleton College
Provider Set:
Teach the Earth
Author:
Corri Taylor
Date Added:
07/06/2017
Choosing healthy data for healthy relationships: how to use 5-point summaries, box and whisker plots, and correlation to understand global health trends. [version 1.0]
Conditional Remix & Share Permitted
CC BY-SA
Rating
0.0 stars

This module utilizes a user-friendly database exploring data selection, box-and-whisker plot, and correlation analysis. It also guides students on how to make a poster of their data and conclusions.

Subject:
Applied Science
Health, Medicine and Nursing
Mathematics
Statistics and Probability
Material Type:
Activity/Lab
Full Course
Lecture
Lesson Plan
Reading
Provider:
BioQUEST Curriculum Consortium
Provider Set:
Quantitative Biology at Community Colleges
Date Added:
06/21/2021
Choropleth Map of the Happiest States
Conditional Remix & Share Permitted
CC BY-NC-SA
Rating
0.0 stars

GIS techniques, data sources, and other resources are so numerous and varied that, even if someone is doing GIS work regularly, it's common to say, "Now how did I do that last time?" or "Where did I get that data?". One of the main goals of my GIS course is to have students create a personal GIS portfolio that will be useful to them in the future, either for projects at Hamilton or in a job after graduation.
Portfolios must include, at a minimum, a spreadsheet of data sources and information about downloading and prepping data from each site; an annotated Word doc of useful web sites; a DVD collection of projects and data from the course; and an organized notebook that contains the items listed above plus all class handouts, exercises, and printouts of products.

What I stress in this assignment is that portfolios need to be more than collections of GIS stuff – they must be useful for the future. To make portfolios useful for the future, students have to give significant thought not only to organization but how they will be able to find information in their portfolios in the future and how they can build indexes, annotations, flow charts, etc. to make their portfolios more than a collection of pieces of paper in a binder.

Subject:
Education
Educational Technology
Mathematics
Measurement and Data
Material Type:
Activity/Lab
Provider:
Science Education Resource Center (SERC) at Carleton College
Provider Set:
Teach the Earth
Author:
Barb Tewksbury
Date Added:
01/20/2023
City Life - Inquiry and Problem Solving Exercise
Unrestricted Use
CC BY
Rating
0.0 stars

Living in a big city like New York can be very challenging. City planning is an interdisciplinary enterprise where social scientists, humanists, psychologists, scientists, statisticians, citizens, politicians, etc. come together to offer solutions to improve quality of life in the city. To find such solutions, these people need clear and reliable (qualitative and quantitative) information about specific challenges that residents and visitors face For the variety of stakeholders in the city, many different things might be considered worthy of study, depending on their interests and needs regarding, e.g., employment, financial status, family size, healthcare, mobility, and education.
For example, do you know whether your neighborhood issufficiently protected from a fire? What about other neighborhoods in the city? To what extent does a CUNY degree help a person gain employment in the City? In which ways do race or gender or sexual preference play a role in how people experience city life? Can these be quantified in dollar terms? Once you have identified a problem, write an essay that describes a question
about city life that you believe is worthy of a statistical study.

Subject:
Mathematics
Statistics and Probability
Material Type:
Textbook
Provider:
CUNY Academic Works
Provider Set:
LaGuardia Community College
Author:
Milena Cuellar
Date Added:
01/01/2017
Class Notes and Worksheets for Calculus: Early Transcendentals
Conditional Remix & Share Permitted
CC BY-NC-SA
Rating
0.0 stars

This set of Calculus 1 Lecture Notes and Worksheets was created under a Round Thirteen Mini-Grant for Ancillary Materials Creation and Revision. These materials were created to supplement the Lyrix version of Calculus: Early Transcendentals (https://lyryx.com/calculus-early-transcendentals/).

Subject:
Calculus
Mathematics
Material Type:
Homework/Assignment
Provider:
University of North Georgia
Author:
Bikash Das
Hashim Saber
Date Added:
10/03/2022
Climate Change and Atlantic Hurricanes: A GIS Inquiry
Conditional Remix & Share Permitted
CC BY-NC-SA
Rating
0.0 stars

Students are asked to make a general hypothesis about whether Atlantic hurricane have been changing over time in response to recent climate change. It is expected that at an introductory level with only the most basic background instruction, students will focus on numbers, locations, or intensities of hurricanes. Example hypotheses might be

The numbers of hurricanes are increasing (or decreasing)
Hurricanes are becoming more intense
Hurricanes are forming in new locations
Hurricane season is lengthening

They are then asked to develop more pointed questions that they can test. Some example questions for each hypothesis are given below:

Hypothesis 1 might lead to questions like "More hurricanes (or tropical storms) are forming each year" or "More hurricanes are striking land each year."
Hypothesis 2 might lead to questions such as "The maximum wind speed for hurricanes is increasing" or "The minimum barometric pressure is decreasing."
Hypothesis 3 might lead to questions like "Hurricanes are forming further north."
Hypothesis 4 might lead to questions such as "Hurricanes are forming earlier and later."

To answer these questions would require students to understand some background about hurricanes, like how many typically occur in the past (which leads to questions about data collection and observing hurricanes), how hurricane intensity is measured, or at what latitudes hurricanes typically form.

Then they are given a table or map data (derived from NOAA GIS data of hurricane tracks and intensity) to test their hypotheses.

The results of their inquiries and data collection will be shared with the class as parts of small groups initially, and will culminate as a small group presentation.

(Note: this resource was added to OER Commons as part of a batch upload of over 2,200 records. If you notice an issue with the quality of the metadata, please let us know by using the 'report' button and we will flag it for consideration.)
Subject:
Applied Science
Biology
Environmental Science
Life Science
Mathematics
Measurement and Data
Oceanography
Physical Science
Material Type:
Activity/Lab
Provider:
Science Education Resource Center (SERC) at Carleton College
Provider Set:
Teach the Earth
Author:
Chris Van de Ven
Date Added:
08/24/2019
Climate Change and Mammal Dispersal
Conditional Remix & Share Permitted
CC BY-NC-SA
Rating
0.0 stars

Students will learn how species shift along environmental gradients (temperature, precipitation, and vegetation) in response to climate change over the last 20,000 years, from the time of the Last Glacial Maximum through deglaciation and the Holocene. The activity involves making maps of species distribution using the Neotoma database. Students will develop skills in data analysis and interpretation over a two-to-four class arc.

(Note: this resource was added to OER Commons as part of a batch upload of over 2,200 records. If you notice an issue with the quality of the metadata, please let us know by using the 'report' button and we will flag it for consideration.)
Subject:
Applied Science
Biology
Environmental Science
History
Information Science
Life Science
Mathematics
Measurement and Data
Material Type:
Activity/Lab
Provider:
Science Education Resource Center (SERC) at Carleton College
Provider Set:
Teach the Earth
Author:
Suzanne Pilaar Birch
Date Added:
03/25/2021