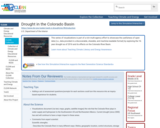
This series of visualizations is part of a rich multi-agency effort to …
This series of visualizations is part of a rich multi-agency effort to showcase the usefulness of open data (i.e., data provided in a discoverable, sharable, and machine-readable format) by exploring the 16-year drought as of 2016 and its effects on the Colorado River Basin.
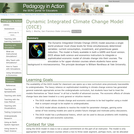
The Dynamic Integrated Climate Change (DICE) model assumes a single world producer …
The Dynamic Integrated Climate Change (DICE) model assumes a single world producer must chose levels for three simultaneously determined variables: current consumption, investment, and greenhouse gases reduction. The model is freely available in both a GAMS and Excel version. DICE allows both science and economics instructors to integrate a sophisticated economic model of climate change into their courses. The simulation is for upper-division courses where students have some background in microeconomics. The principle developer is William Nordhaus at Yale University.
Workplace English for the Canadian medical laboratory. Learn how to calculate your …
Workplace English for the Canadian medical laboratory. Learn how to calculate your patient's heart rate by counting large squares on an electrocardiogram. .P...
This is an Economics Grade 11 Course.Content that is taught includes the …
This is an Economics Grade 11 Course.Content that is taught includes the following:Lesson 1 on different kinds of marketsLesson 2 on Perfect Competition market structureLesson 3 on Monopoly market structureLesson 4 on Monopolistic Competition market structureLesson 5 on Oligopoly market structure
This is my culminating EDTC 5401 Professional Development tutorial and presentation on …
This is my culminating EDTC 5401 Professional Development tutorial and presentation on Scratch, a multidisciplinary tool through which students grades 3-11 can design interactive stories, games, and animations.
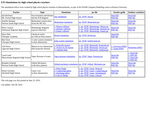
This web page features a collection of Easy Java Simulations developed by …
This web page features a collection of Easy Java Simulations developed by secondary teachers for use in introductory high school physics courses. Topics include astronomy, momentum and collision, projectile motion, Gauss's Law and electric field, special relativity, and more. Each simulation is accompanied by a standards-based lesson plan and printable student guides. Users may run the simulations as a Java applet or may directly download a jar file version. The materials in this collection were created with Easy Java Simulations (EJS), a modeling tool that allows users without formal programming experience to generate computer models and simulations. To modify or customize the model, See Related Materials for detailed instructions on installing and running the EJS Modeling and Authoring Tool. This resource is part of Project ITOP (Improving the Teaching of Physics), a graduate program offered at University of Massachusetts-Boston. The archived computer models are hosted and maintained as part of the BU Physics Simulation collection.
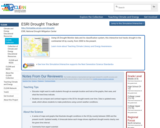
Using US Drought Monitor data and its classification system, this interactive tool …
Using US Drought Monitor data and its classification system, this interactive tool tracks drought in the continental US by county, from 2000 to the present.
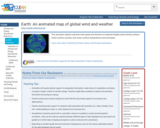
This animation depicts real-time wind speed and direction at selected heights above …
This animation depicts real-time wind speed and direction at selected heights above Earth's surface, ocean surface currents, and ocean surface temperatures and anomalies.
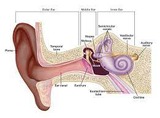
In this demonstration, evidence of the Earth's rotation is observed. A tripod, …
In this demonstration, evidence of the Earth's rotation is observed. A tripod, swiveling desk chair, fishing line and pendulum bob (e.g., fishing weight or plumb bob) are required for the demonstration. This resource is from PUMAS - Practical Uses of Math and Science - a collection of brief examples created by scientists and engineers showing how math and science topics taught in K-12 classes have real world applications.
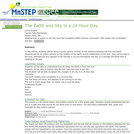
This is an indoor and outdoor activity where students understand the distance …
This is an indoor and outdoor activity where students understand the distance the earth is from the sun. The students understand that the earth rotates on it's axis once in a 24 hour period thus providing us with day and night.
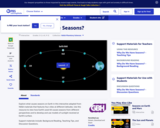
This interactive activity from the Adler Planetarium explains the reasons for the …
This interactive activity from the Adler Planetarium explains the reasons for the seasons. Featured is a game in which Earth must be properly placed in its orbit in order to send Max, the host, to different parts of the world during particular seasons.
The earthquake game teaches how scientists learn about real earthquakes. The player …
The earthquake game teaches how scientists learn about real earthquakes. The player must learn about S& P waves and triangulation to determine the epicenter of the earthquake that hit the cities.
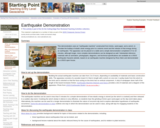
This demonstration uses an "earthquake machine" constructed from bricks, sand paper, and …
This demonstration uses an "earthquake machine" constructed from bricks, sand paper, and a winch, to simulate the buildup of elastic strain energy prior to a seismic event and the release of that energy during an earthquake.
(Note: this resource was added to OER Commons as part of a batch upload of over 2,200 records. If you notice an issue with the quality of the metadata, please let us know by using the 'report' button and we will flag it for consideration.)
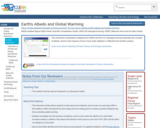
This interactive visualization adapted from NASA and the U.S. Geological Survey illustrates …
This interactive visualization adapted from NASA and the U.S. Geological Survey illustrates the concept of albedo, which is the measure of how much solar radiation is reflected from Earth's surface.
How many calories are in your favorite foods? How much exercise would …
How many calories are in your favorite foods? How much exercise would you have to do to burn off these calories? What is the relationship between calories and weight? Explore these issues by choosing diet and exercise and keeping an eye on your weight.
This highly informative site explores five different ecosystems and the public health …
This highly informative site explores five different ecosystems and the public health issues that have arisen in each. Students can explore the different ways that ecosystem services that address air quality, heat hazard mitigation, recreation and physical activity, water hazard mitigation, and water quality impact many health conditions.
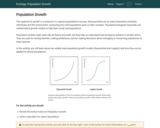
Ecology: Population Growth is a Canadian adaptation of Connecting Concepts: Interactive Lessons …
Ecology: Population Growth is a Canadian adaptation of Connecting Concepts: Interactive Lessons in Biology by Robert Jeanne and Jan Cheetham (University of Wisconsin). It includes interactive lessons on exponential growth focusing on the zebra mussel population, logistic growth using fish as an example, and elephant population growth. / Croissance des populations est une adaptation canadienne de Connecting Concepts: Interactive Lessons in Biology de Robert Jeanne et Jan Cheetham (University of Wisconsin). Ces leçons interactives portent sur la croissance exponentielle à l’aide d’une population de moules zébrées, la croissance logistique selon l’exemple des poissons et la croissance d’une population d’éléphants.
This site contains 21 modular, easy to use economic models, that are …
This site contains 21 modular, easy to use economic models, that are appropriate for class assignments or in-class demonstrations. Students can simulate all the standard models taught in most economics courses. EconModel uses the Windows OS. The simulations were developed by William R. Parke of the University of North Carolina at Chapel Hill.
This website is an interactive educational application developed to simulate and visualize …
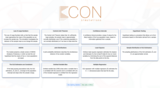
This website is an interactive educational application developed to simulate and visualize various statistical concepts:
Law of Large Numbers Central Limit Theorem Confidence Intervals Hypothesis Testing ANOVA Joint Distributions Least Squares Sample Distribution of OLS Estimators The OLS Estimators are Consistent Omitted Variable Bias Multiple Regression
Project of Professor Tanya Byker and Professor Amanda Gregg at Middlebury College, with research assistants Kevin Serrao, Class of 2018, Dylan Mortimer, Class of 2019, Ammar Almahdy, Class of 2020, Jacqueline Palacios, Class of 2020, Siyuan Niu, Class of 2021, David Gikoshvili, Class of 2021, and Ethan Saxenian, Class of 2022.
No restrictions on your remixing, redistributing, or making derivative works. Give credit to the author, as required.
Your remixing, redistributing, or making derivatives works comes with some restrictions, including how it is shared.
Your redistributing comes with some restrictions. Do not remix or make derivative works.
Most restrictive license type. Prohibits most uses, sharing, and any changes.
Copyrighted materials, available under Fair Use and the TEACH Act for US-based educators, or other custom arrangements. Go to the resource provider to see their individual restrictions.